Image Processing Tools → Classification
- EvaluateTrainingSites
- GeneralizeClassifiedRaster
- GeneralizeWithSimilarity
- ImageSegmentation
- MinDistClassification
- ParallelepipedClassification
EvaluateTrainingSites
Note this tool is part of a WhiteboxTools extension product. Please visit Whitebox Geospatial Inc. for information about purchasing a license activation key (https://www.whiteboxgeo.com/extension-pricing/).
This tool performs an evaluation of the reflectance properties of multi-spectral image dataset for a
group of digitized class polygons. This is often viewed as the first step in a supervised classification
procedure, such as those performed using the MinDistClassification or ParallelepipedClassification
tools. The analysis is based on a series of one or more input images (--inputs) and an input polygon
vector file (--polys). The user must also specify the attribute name (--field), within the attribute
table, containing the class ID associated with each feature in input the polygon vector. A single class
may be designated by multiple polygon features in the test site polygon vector. Note that the
input polygon file is generally created by digitizing training areas of exemplar reflectance properties for each
class type. The input polygon vector should be in the same coordinate system as the input multi-spectral images.
The input images must represent a multi-spectral data set made up of individual bands.
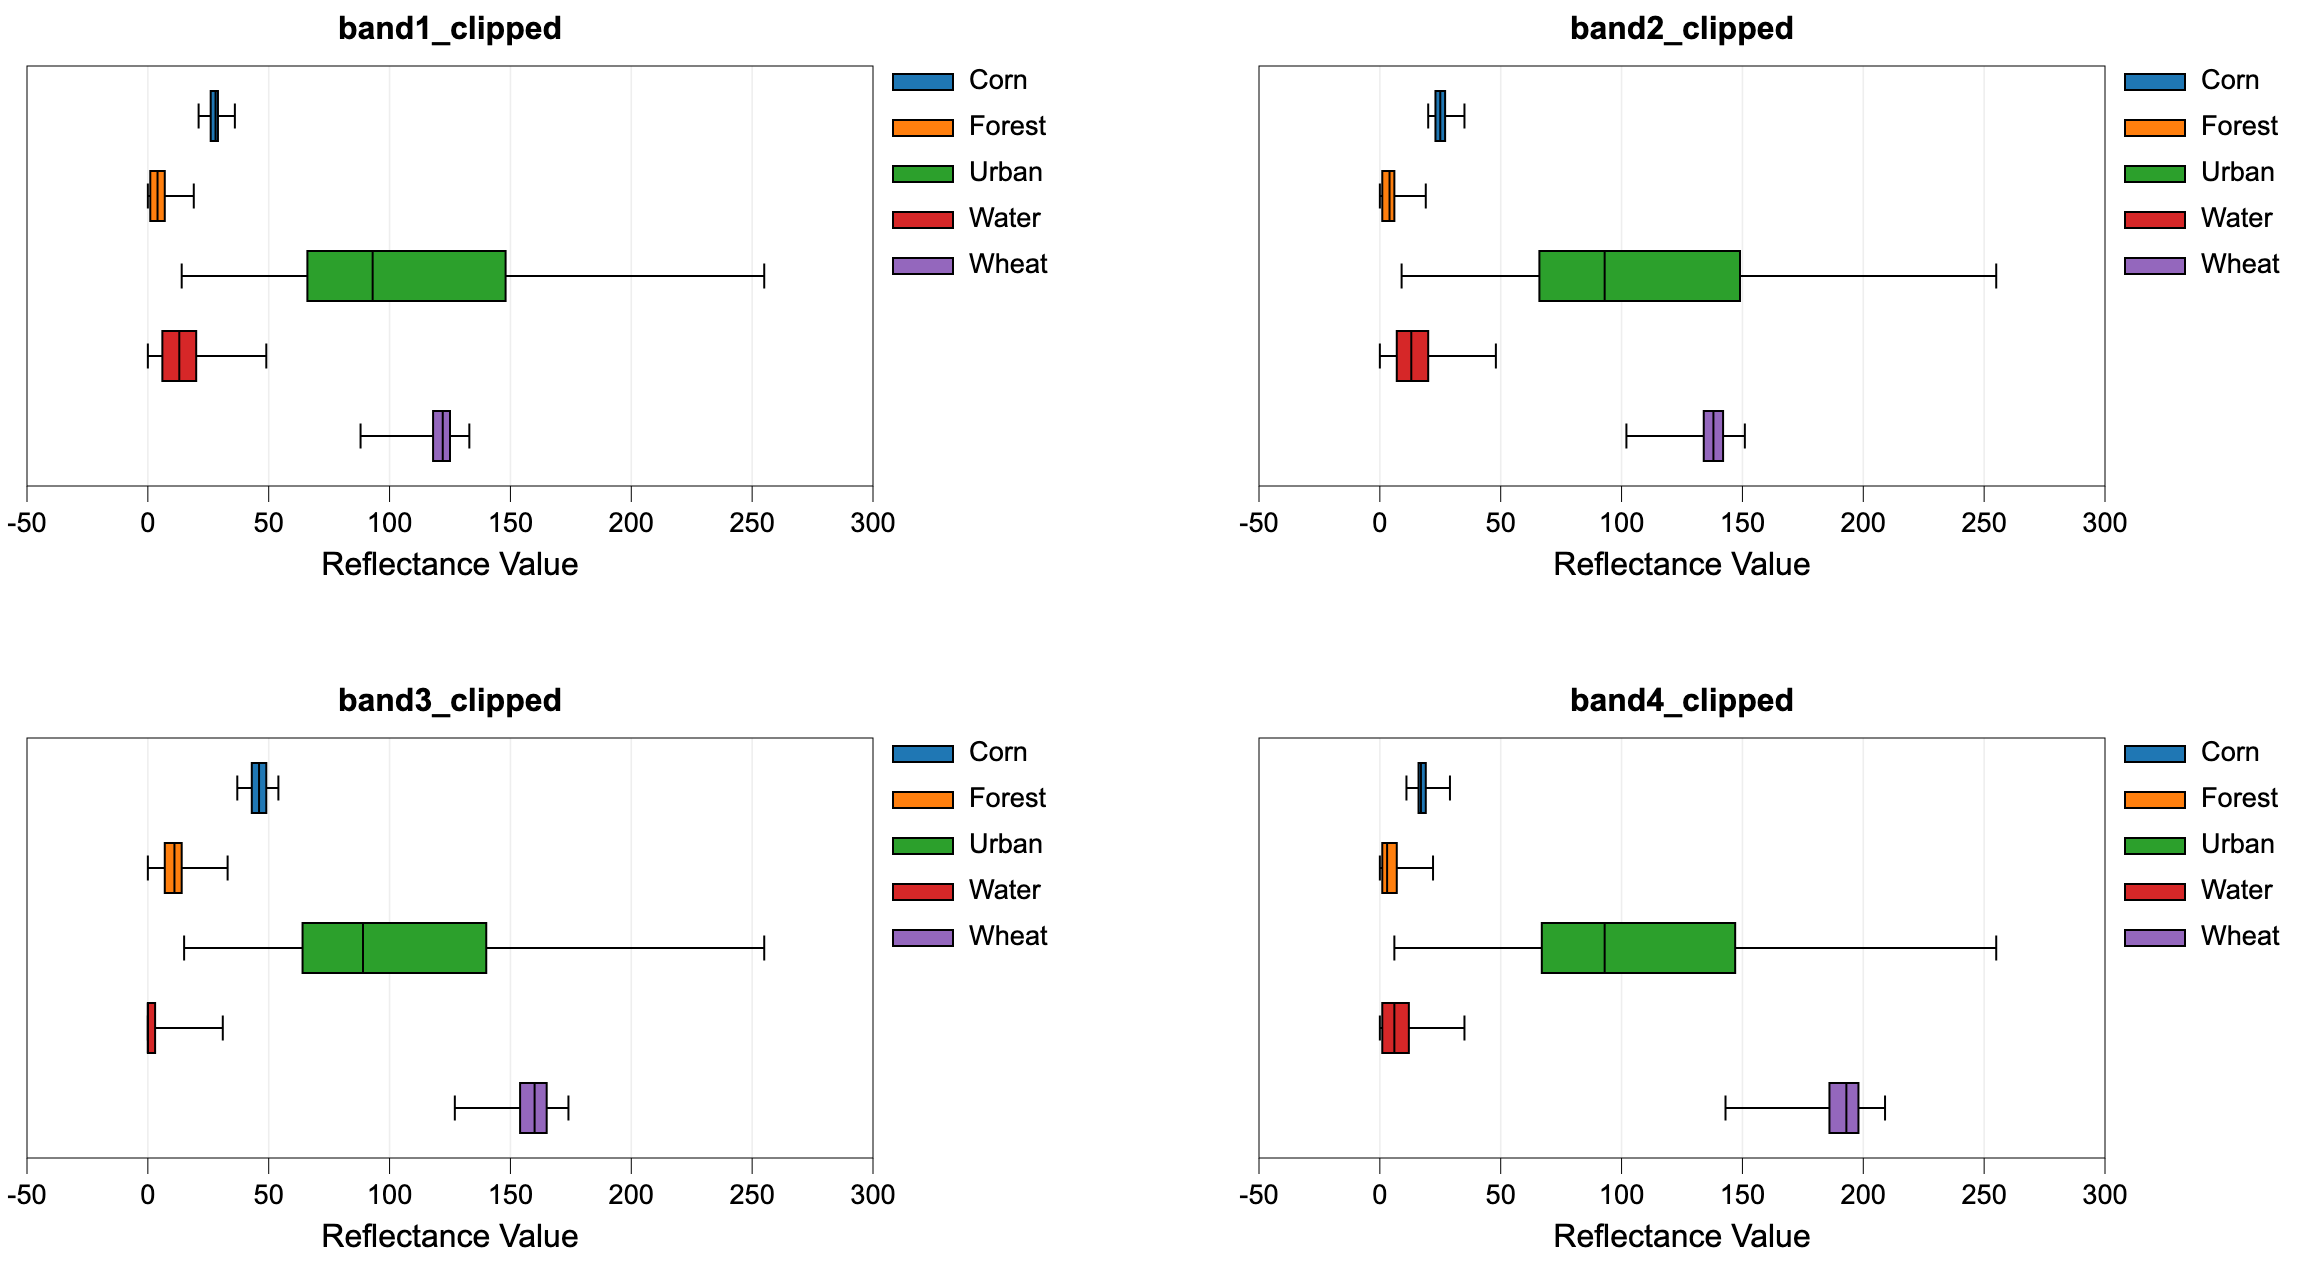
Do not input colour composite images. Lastly, the user must specify the name of the output HTML file.
This file will contain a series of box-and-whisker plots, one
for each band in the multi-spectral data set, that visualize the distribution of each class in the
associated bands. This can be helpful in determining the overlap between spectral properties for the
classes, which may be useful if further class or test site refinement is necessary. For a subsequent
supervised classification to be successful, each class should not overlap significantly with the other
classes in at least one of the input bands. If this is not the case, the user may need to refine
the class system.
See Also: MinDistClassification, ParallelepipedClassification
Parameters:
| Flag | Description |
|---|---|
| -i, --inputs | Name of the input band images |
| -p, --polys | Name of the input training site polygons shapefile |
| -f, --field | Name of the attribute containing class name data |
| -o, --output | Name of the output report file (*.html) |
Python function:
wbt.evaluate_training_sites(
    inputs,
    polys,
    field,
    output,
    callback=default_callback
)
Command-line Interface:
>> ./whitebox_tools -r=EvaluateTrainingSites ^
--inputs="band1.tif;band2.tif;band3.tif;band4.tif" ^
--polys=training_sites.shp --field=CLASS ^
-o=class_properties.html
Source code is unavailable due to proprietary license.
Author: Whitebox Geospatial Inc. (c)
Created: 20/03/2021
Last Modified: 20/03/2021
GeneralizeClassifiedRaster
Note this tool is part of a WhiteboxTools extension product. Please visit Whitebox Geospatial Inc. for information about purchasing a license activation key (https://www.whiteboxgeo.com/extension-pricing/).
This tool can be used to generalize a raster containing class or object features. Such rasters are usually derived from some classification procedure (e.g. image classification and landform classification), or as the output of a segmentation procedure (ImageSegmentation). Rasters that are created in this way often contain many very small features that make their interpretation, or vectorization, challenging. Therefore, it is common for practitioners to remove the smaller features. Many different approaches have been used for this task in the past. For example, it is common to remove small features using a filtering based approach (MajorityFilter). While this can be an effective strategy, it does have the disadvantage of modifying all of the boundaries in the class raster, including those that define larger features. In many applications, this can be a serious issue of concern.
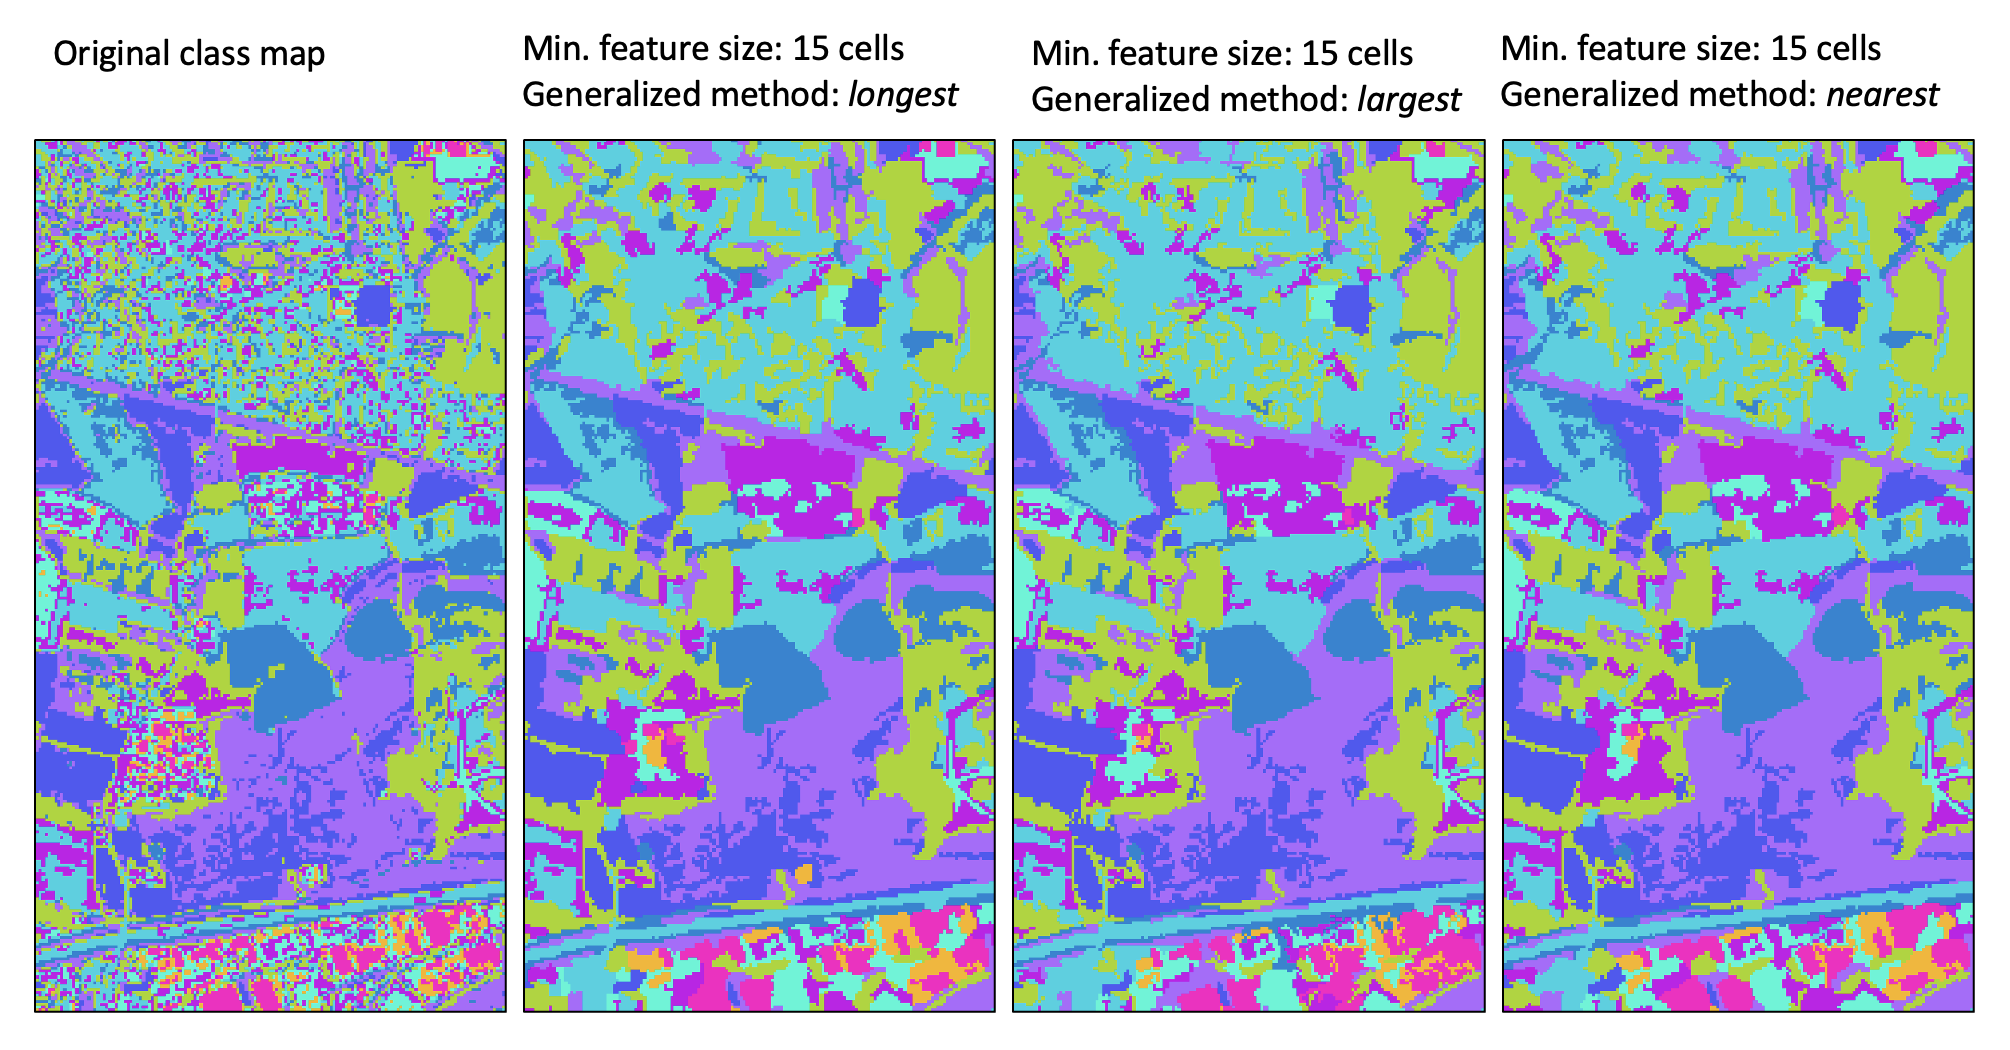
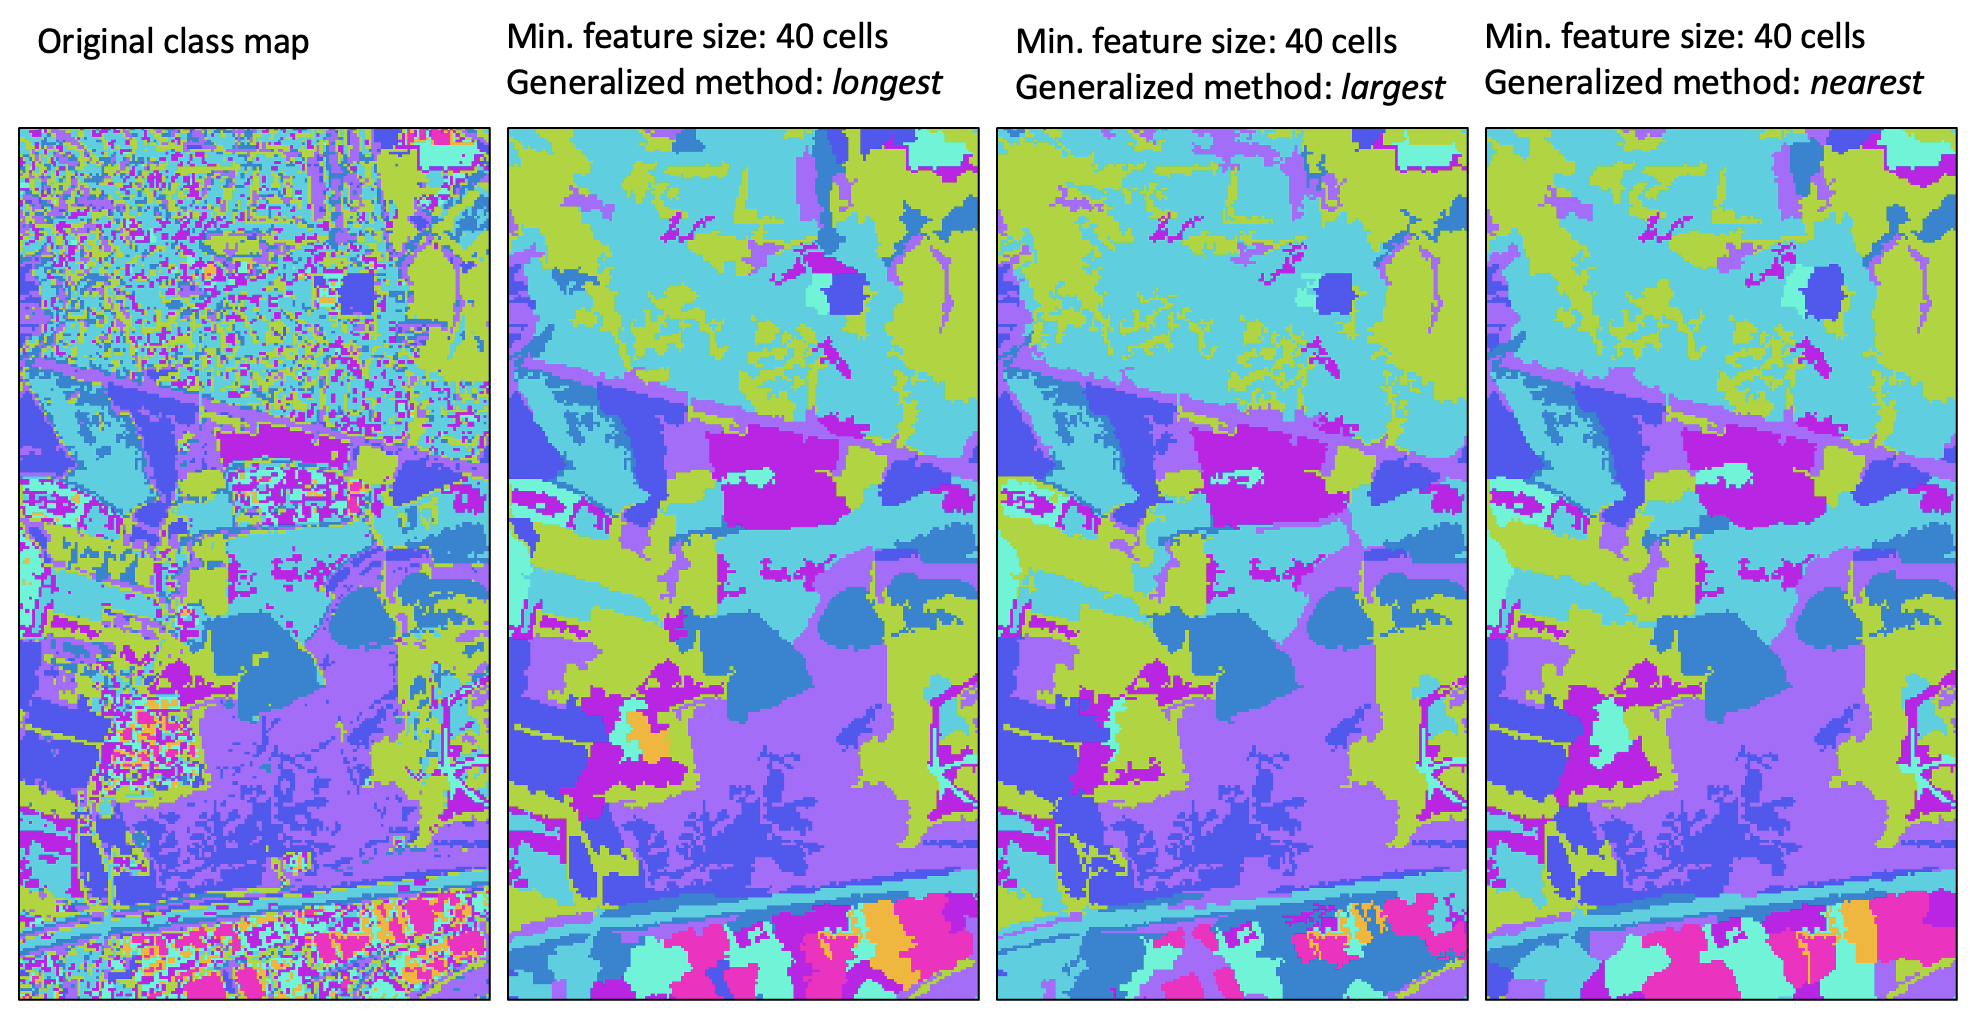
The GeneralizeClassifiedRaster tool offers an alternative method for simplifying class rasters.
The process begins by identifying each contiguous group of cells in the input (i.e. a clumping
operation) and then defines the subset of features that are smaller than the user-specified minimum
feature size (--min_size), in grid cells. This set of small features is then dealt with using
one of three methods (--method). In the first method (longest), a small feature may be reassigned the class value
of the neighbouring feature with the longest shared border. The sum of the neighbouring
feature size and the small feature size must be larger than the specified size threshold, and the tool will iterate through this
process of reassigning feature values to neighbouring values until each small feature has been resolved.
The second method, largest, operates in much the same way as the first, except that objects are reassigned the value of the largest neighbour. Again, this process of reassigning small feature values iterates until every small feature has been reassigned to a large neighbouring feature.
The third and last method (nearest) takes a different approach to resolving the reassignment of small features. Using the nearest generalization approach, each grid cell contained within a small feature is reassigned the value of the nearest large neighbouring feature. When there are two or more neighbouring features that are equally distanced to a small feature cell, the cell will be reassigned to the largest neighbour. Perhaps the most significant disadvantage of this approach is that it creates a new artificial boundary in the output image that is not contained within the input class raster. That is, with the previous two methods, boundaries associated with smaller features in the input images are 'erased' in the output map, but every boundary in the output raster exactly matches boundaries within the input raster (i.e. the output boundaries are a subset of the input feature boundaries). However, with the nearest method, artificial boundaries, determined by the divide between nearest neighbours, are introduced to the output raster and these new feature boundaries do not have any basis in the original classification/segmentation process. Thus caution should be exercised when using this approach, especially when larger minimum size thresholds are used. The longest method is the recommended approach to class feature generalization.
For a video tutorial on how to use the GeneralizeClassifiedRaster tool, see this YouTube video.
See Also: GeneralizeWithSimilarity, MajorityFilter, ImageSegmentation
Parameters:
| Flag | Description |
|---|---|
| -i, --input | Name of the input raster image file |
| -o, --output | Name of the output raster file |
| --min_size | Minimum feature size, in grid cells |
| --method | Grouping method; one of 'longest' (default), 'largest', and 'nearest' |
Python function:
wbt.generalize_classified_raster(
    i,
    output,
    min_size=4,
    method="longest",
    callback=default_callback
)
Command-line Interface:
>> ./whitebox_tools -r=GeneralizeClassifiedRaster ^
-i='classMap.tif' -o=newClassMap.tif --min_size=5 ^
--method='longest'
Source code is unavailable due to proprietary license.
Author: Whitebox Geospatial Inc. (c)
Created: 27/11/2021
Last Modified: 02/12/2021
GeneralizeWithSimilarity
Note this tool is part of a WhiteboxTools extension product. Please visit Whitebox Geospatial Inc. for information about purchasing a license activation key (https://www.whiteboxgeo.com/extension-pricing/).
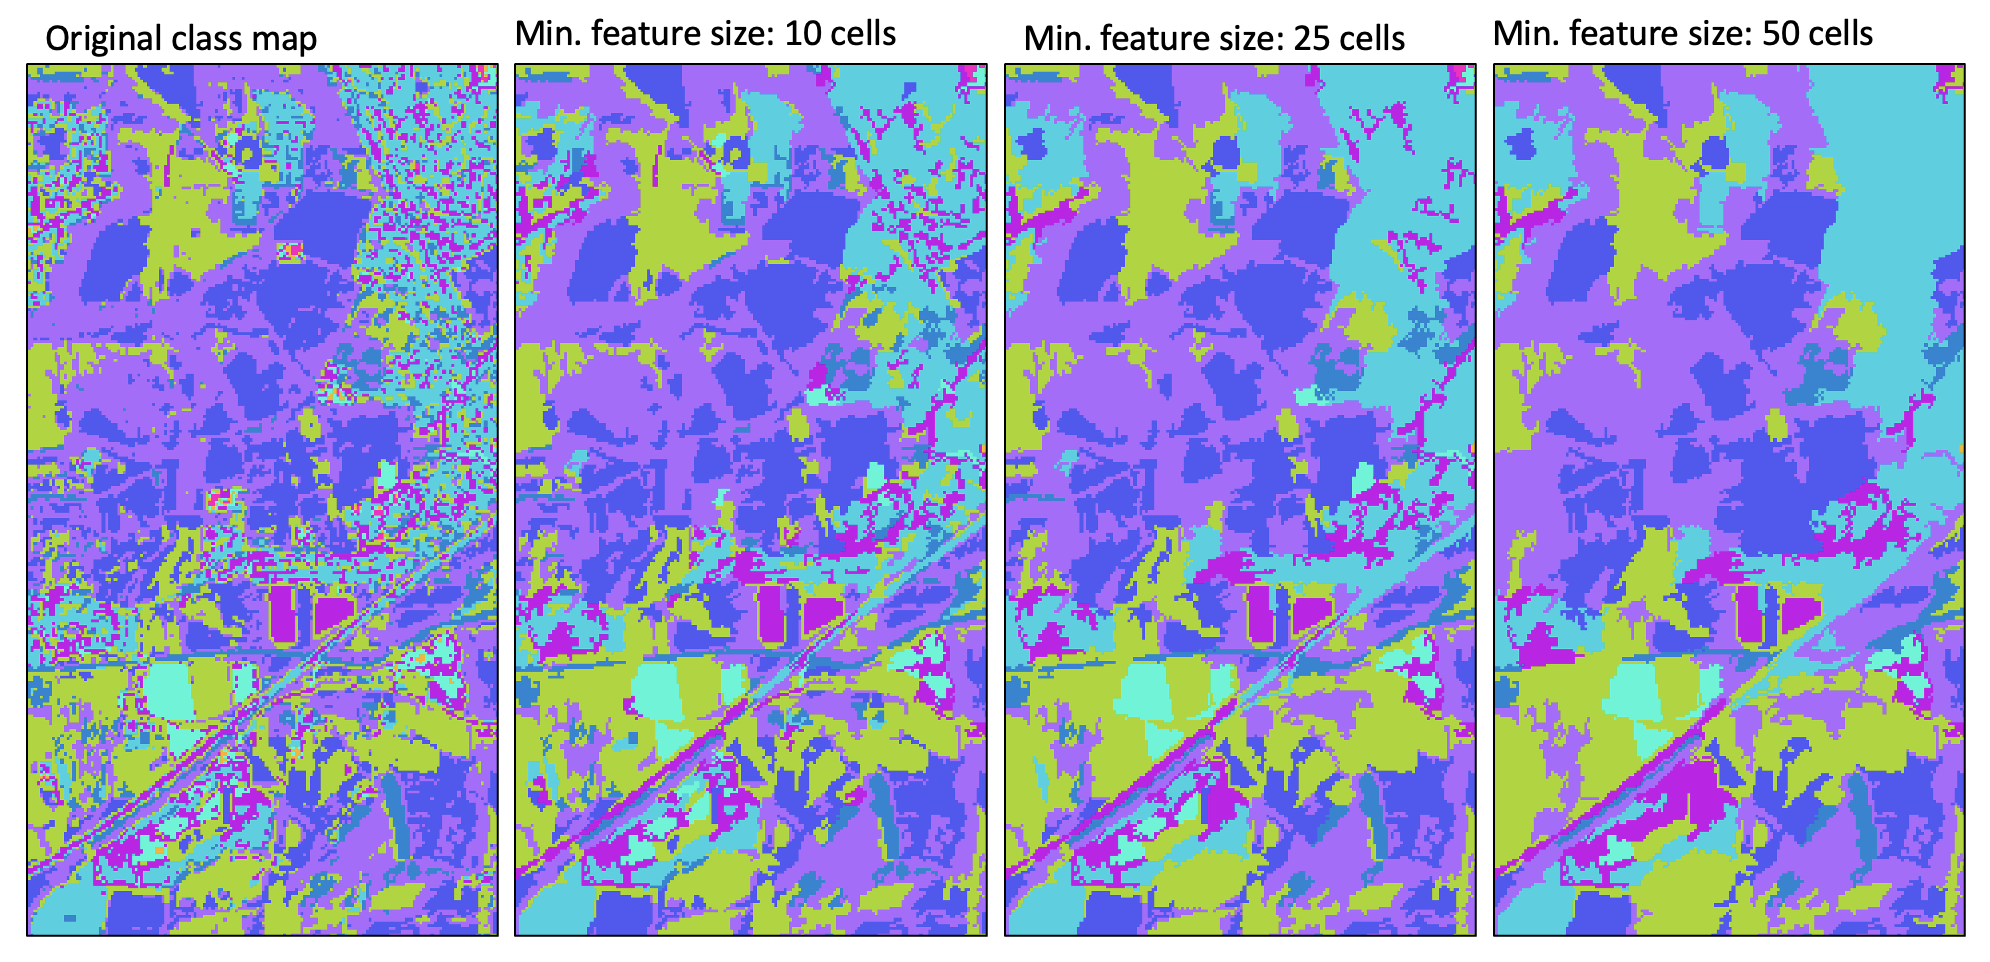
This tool can be used to generalize a raster containing class features (--input) by reassigning
the identifier values of small features (--min_size) to those of neighbouring features. Therefore, this tool
performs a very similar operation to the GeneralizeClassifiedRaster tool. However, while the
GeneralizeClassifiedRaster tool re-labels small features based on the geometric properties of
neighbouring features (e.g. neighbour with the longest shared border, largest neighbour, or
nearest neighbour), the GeneralizeWithSimilarity tool reassigns feature labels based on
similarity with neighbouring features. Similarity is determined using a series of input similarity
criteria rasters (--similarity), which may be factors used in the creation of the input
class raster. For example, the similarlity rasters may be bands of multi-spectral imagery, if the
input raster is a classified land-cover map, or DEM-derived land surface parameters, if the input
raster is a landform class map.
The tool works by identifying each contiguous group of pixels (features) in the input class raster (--input),
i.e. a clumping operation. The mean value is then calculated for each feature and each similarity
input, which defines a multi-dimensional 'similarity centre point' associated with each feature. It should be noted
that the similarity raster data are standardized prior to calculating these centre point values.
Lastly, the tool then reassigns the input label values of all features smaller than the user-specified
minimum feature size (--min_size) to that of the neighbouring feature with the shortest distance
between similarity centre points.
For small features that are entirely enclosed by a single larger feature, this process will result in the same generalization solution presented by any of the geometric-based methods of the GeneralizeClassifiedRaster tool. However, for small features that have more than one neighbour, this tool may provide a superior generalization solution than those based solely on geometric information.
For a video tutorial on how to use the GeneralizeWithSimilarity tool, see this YouTube video.
See Also: GeneralizeClassifiedRaster, MajorityFilter, ImageSegmentation
Parameters:
| Flag | Description |
|---|---|
| -i, --input | Name of the input raster image file |
| --similarity | Names of the input similarity images |
| -o, --output | Name of the output raster file |
| --min_size | Minimum feature size, in grid cells |
Python function:
wbt.generalize_with_similarity(
    i,
    similarity,
    output,
    min_size=4,
    callback=default_callback
)
Command-line Interface:
>> ./whitebox_tools -r=GeneralizeWithSimilarity ^
-i='classMap.tif' --similarity='band1.tif;band2.tif;band3.tif' ^
-o=newClassMap.tif --min_size=5
Source code is unavailable due to proprietary license.
Author: Whitebox Geospatial Inc. (c)
Created: 03/12/2021
Last Modified: 05/12/2021
ImageSegmentation
Note this tool is part of a WhiteboxTools extension product. Please visit Whitebox Geospatial Inc. for information about purchasing a license activation key (https://www.whiteboxgeo.com/extension-pricing/).
This tool is used to segment a mult-spectral image data set, or multi-dimensional data stack. The
algorithm is based on region-growing operations. Each of the input images are transformed into
standard scores prior to analysis. The total multi-dimensional
distance between each pixel and its eight neighbours is measured, which then serves as a priority
value for selecting potential seed pixels for the region-growing operations, with pixels exhibited the least
difference with their neighbours more likely to serve as seeds. The region-growing operations
initiate at seed pixels and grows outwards, connecting neighbouring pixels that have a multi-dimensional
distance from the seed cell that is less than a threshold value. Thus, the region-growing operations attempt
to identify contiguous, relatively homogeneous objects. The algorithm stratifies potential seed pixels into
bands, based on their total difference with their eight neighbours. The user may control the size and number
of these bands using the --threshold and --steps parameters respectively. Increasing the magnitude of the
threshold parameter will result in fewer mapped objects and vice versa. All pixels that are not assigned to an
object after the seeding-based region-growing operations are then clumped simply based on contiguity.
It is commonly the case that there will be a large number of very small-sized objects identified using this
approach. The user may optionally specify that objects that are less than a minimum area (expressed in pixels)
be eliminated from the final output raster. The --min_area parameter must be an integer between 1 and 8. In
cleaning small objects from the output, the pixels belonging to these smaller features are assigned to the
most homogeneous neighbouring object.
The input rasters (--inputs) may be bands of satellite imagery, or any other attribute, such as measures
of texture, elevation, or other topographic derivatives, such as slope. If satellite imagery is used
as inputs, it can be beneficial to pre-process the data with an edge-preserving low-pass filter, such as
the BilateralFilter and EdgePreservingMeanFilter tools.
See Also: BilateralFilter, EdgePreservingMeanFilter
Parameters:
| Flag | Description |
|---|---|
| -i, --inputs | Names of the input band images |
| -o, --output | Name of the output raster file |
| --threshold | Distance threshold, in z-scores |
| --steps | Number of steps |
| --min_area | Minimum object area, in grid cells (1-8) |
Python function:
wbt.image_segmentation(
    inputs,
    output,
    threshold=0.5,
    steps=10,
    min_area=4,
    callback=default_callback
)
Command-line Interface:
>> ./whitebox_tools -r=ImageSegmentation ^
-i='band1.tif; band2.tif; band3.tif; band4.tif' -o=segmented.tif ^
--threshold=4.0 --steps=10 --min_area=4
Source code is unavailable due to proprietary license.
Author: Whitebox Geospatial Inc. (c)
Created: 28/05/2021
Last Modified: 28/05/2021
MinDistClassification
Note this tool is part of a WhiteboxTools extension product. Please visit Whitebox Geospatial Inc. for information about purchasing a license activation key (https://www.whiteboxgeo.com/extension-pricing/).
This tool performs a supervised minimum-distance classification using training site polygons (--polys) and
multi-spectral images (--inputs). This classification method uses the mean vectors for each class and
calculates the Euclidean distance from each unknown pixel to the class mean vector. Unclassed pixels are
then assigned to the nearest class mean. A threshold distance (--threshold), expressed in number of z-scores,
may optionally be used and pixels whose multi-spectral distance is greater than this threshold will not be
assigned a class in the output
image (--output). When a threshold distance is unspecified, all pixels will be assigned to a class.
Like all supervised classification methods, this technique relies heavily on proper selection of training data. Training sites are exemplar areas of known and representative land cover type. The algorithm determines the spectral signature of the pixels within each training area, and uses this information to define the mean vector of each class. It is preferable that training sites are based on either field-collected data or fine-resolution reference imagery. In selecting training sites, care should be taken to ensure that they cover the full range of variability within each class. Otherwise the classification accuracy will be impacted. If possible, multiple training sites should be selected for each class. It is also advisable to avoid areas near the edges of land-cover patches, where mixed pixels may impact the purity of training site reflectance values.
After selecting training sites, the reflectance values of each land-cover type can be assessed using the EvaluateTrainingSites tool. In particular, the distribution of reflectance values should ideally be non-overlapping in at least one band of the multi-spectral data set.
See Also: EvaluateTrainingSites, ParallelepipedClassification
Parameters:
| Flag | Description |
|---|---|
| -i, --inputs | Names of the input band images |
| -p, --polys | Name of the input training site polygons shapefile |
| -f, --field | Name of the attribute containing class name data |
| -o, --output | Name of the output raster file |
| --threshold | Distance threshold, in z-scores; blank for none |
Python function:
wbt.min_dist_classification(
    inputs,
    polys,
    field,
    output,
    threshold=None,
    callback=default_callback
)
Command-line Interface:
>> ./whitebox_tools -r=MinDistClassification ^
-i='band1.tif; band2.tif; band3.tif; band4.tif' ^
-p=training_sites.shp -f='LAND_COVER' -o=classified.tif ^
--threshold=4.0
Source code is unavailable due to proprietary license.
Author: Whitebox Geospatial Inc. (c)
Created: 22/03/2021
Last Modified: 22/03/2021
ParallelepipedClassification
Note this tool is part of a WhiteboxTools extension product. Please visit Whitebox Geospatial Inc. for information about purchasing a license activation key (https://www.whiteboxgeo.com/extension-pricing/).
This tool performs a supervised parallelepiped classification
using training site polygons (--polys) and multi-spectral images (--inputs). This classification method
uses the minimum and maximum reflectance values for each class within the training data to characterize a set
of parallelepipeds, i.e. multi-dimensional geometric shapes.
The algorithm then assigns each unknown pixel in the image data set to the first class for which the pixel's
spectral vector is contained within the corresponding class parallelepiped. Pixels with spectral vectors that
are not contained within any class parallelepiped will not be assigned a class in the output image.
Like all supervised classification methods, this technique relies heavily on proper selection of training data. Training sites are exemplar areas of known and representative land cover type. The algorithm determines the spectral signature of the pixels within each training area, and uses this information to define the mean vector of each class. It is preferable that training sites are based on either field-collected data or fine-resolution reference imagery. In selecting training sites, care should be taken to ensure that they cover the full range of variability within each class. Otherwise the classification accuracy will be impacted. If possible, multiple training sites should be selected for each class. It is also advisable to avoid areas near the edges of land-cover patches, where mixed pixels may impact the purity of training site reflectance values.
After selecting training sites, the reflectance values of each land-cover type can be assessed using the EvaluateTrainingSites tool. In particular, the distribution of reflectance values should ideally be non-overlapping in at least one band of the multi-spectral data set.
See Also: EvaluateTrainingSites, MinDistClassification
Parameters:
| Flag | Description |
|---|---|
| -i, --inputs | Name of the input band images |
| -p, --polys | Name of the input training site polygons shapefile |
| -f, --field | Name of the attribute containing class name data |
| -o, --output | Name of the output raster file |
Python function:
wbt.parallelepiped_classification(
    inputs,
    polys,
    field,
    output,
    callback=default_callback
)
Command-line Interface:
>> ./whitebox_tools -r=ParallelepipedClassification ^
-i='band1.tif; band2.tif; band3.tif; band4.tif' ^
-p=training_sites.shp -f='LAND_COVER' -o=classified.tif
Source code is unavailable due to proprietary license.
Author: Whitebox Geospatial Inc. (c)
Created: 21/03/2021
Last Modified: 21/03/2021