Stream Network Analysis
- CorrectStreamVectorDirection
- DistanceToOutlet
- ExtractStreams
- ExtractValleys
- FarthestChannelHead
- FindMainStem
- HackStreamOrder
- HortonStreamOrder
- LengthOfUpstreamChannels
- LongProfile
- LongProfileFromPoints
- PruneVectorStreams
- RasterStreamsToVector
- RasterizeStreams
- RemoveShortStreams
- RepairStreamVectorTopology
- ShreveStreamMagnitude
- StrahlerStreamOrder
- StreamLinkClass
- StreamLinkIdentifier
- StreamLinkLength
- StreamLinkSlope
- StreamSlopeContinuous
- TopologicalStreamOrder
- TributaryIdentifier
- VectorStreamNetworkAnalysis
CorrectStreamVectorDirection
This tool can be used to resolve many of the topological errors and inconsistencies associated with manually digitized vector stream networks, i.e. hydrography data. A properly structured stream network should consist of a series of stream segments that connect a channel head to a downstream confluence, or an upstream confluence to a downstream confluence/outlet. This tool will join vector arcs that connect at arbitrary, non-confluence points along stream segments. It also splits an arc where a tributary stream connects at a mid-point, thereby creating a proper confluence where two upstream triburaries converge into a downstream segment. The tool also handles non-connecting tributaries caused by dangling arcs, i.e. overshoots and undershoots.

The user may optinally specify the name of the input vector stream network (--input) and the output file
(--output). Note that if an input file is not specified by the user, the tool will search for all vector
files (*.shp) files contained within the current working directory. This feature can be very useful when
you need to process a large number of stream files contained within a single directory. The tool will
process the files in parallel in this batch mode.
A distance threshold for snapping dangling arcs (--snap) must be specified by the user. This distance
is in the input layer's x-y units. The tool works best on projected input
data, however, if the input are in geographic coordinates (latitude and longitude), then specifying a
small valued snap distance is advisable.
Notice that the attributes of the input layer will not be carried over to the output file because there is not a one-for-one feature correspondence between the two files due to the joins and splits of stream segments. Instead the output attribute table will only contain a feature ID (FID) entry.
Note: this tool should be used to pre-process vector streams that are input to the VectorStreamNetworkAnalysis tool.
See Also: VectorStreamNetworkAnalysis, FixDanglingArcs
Parameters:
| Flag | Description |
|---|---|
| -i, --input | Name of the input lines vector file |
| --outlet | Name of the input outlet vector points file |
| -o, --output | Name of the output lines vector file |
| --snap, --dist | Snap distance, in xy units (metres) |
Python function:
wbt.correct_stream_vector_direction(
    i,
    outlet,
    output,
    dist="",
    callback=default_callback
)
Command-line Interface:
>> ./whitebox_tools -r=CorrectStreamVectorDirection ^
--input=streams.shp --outlet=outlet.shp ^
--output=streams_fixed.shp --snap=2.0
Author: Prof. John Lindsay
Created: 15/08/2023 (oringinally in Whitebox Toolset Extension)
Last Modified: 15/08/2023
DistanceToOutlet
This tool calculates the distance of stream grid cells to the channel network outlet cell for each grid cell belonging to a
raster stream network. The user must specify the name of a raster containing streams data (--streams), where
stream grid cells are denoted by all positive non-zero values, and a D8 flow pointer (i.e. flow direction) raster
(--d8_pntr). The pointer image is used to traverse the stream network and must only be created using the D8 algorithm.
Stream cells are designated in the streams image as all values
greater than zero. Thus, all non-stream or background grid cells are commonly assigned either zeros or NoData
values. Background cells will be assigned the NoData value in the output image, unless the --zero_background
parameter is used, in which case non-stream cells will be assigned zero values in the output.
By default, the pointer raster is assumed to use the clockwise indexing method used by WhiteboxTools.
If the pointer file contains ESRI flow direction values instead, the --esri_pntr parameter must be specified.
See Also: DownslopeDistanceToStream, LengthOfUpstreamChannels
Parameters:
| Flag | Description |
|---|---|
| --d8_pntr | Input raster D8 pointer file |
| --streams | Input raster streams file |
| -o, --output | Output raster file |
| --esri_pntr | D8 pointer uses the ESRI style scheme |
| --zero_background | Flag indicating whether a background value of zero should be used |
Python function:
wbt.distance_to_outlet(
    d8_pntr,
    streams,
    output,
    esri_pntr=False,
    zero_background=False,
    callback=default_callback
)
Command-line Interface:
>>./whitebox_tools -r=DistanceToOutlet -v ^
--wd="/path/to/data/" --d8_pntr=D8.tif --streams=streams.tif ^
-o=output.tif
>>./whitebox_tools -r=DistanceToOutlet -v ^
--wd="/path/to/data/" --d8_pntr=D8.tif --streams=streams.tif ^
-o=output.tif --esri_pntr --zero_background
Author: Dr. John Lindsay
Created: 13/07/2017
Last Modified: 18/10/2019
ExtractStreams
This tool can be used to extract, or map, the likely stream cells from an input flow-accumulation image
(--flow_accum). The algorithm applies a threshold to the input flow accumulation image such that streams
are considered to be all grid cells with accumulation values greater than the specified threshold
(--threshold). As such, this threshold represents the minimum area (area is used here as a surrogate
for discharge) required to initiate and maintain a channel. Smaller threshold values result in more
extensive stream networks and vice versa. Unfortunately there is very little guidance regarding an appropriate
method for determining the channel initiation area threshold. As such, it is frequently determined either by
examining map or imagery data or by experimentation until a suitable or desirable channel network is
identified. Notice that the threshold value will be unique for each landscape and dataset (including source
and grid resolution), further complicating its a priori determination. There is also evidence that in some
landscape the threshold is a combined upslope area-slope function. Generally, a lower threshold is appropriate
in humid climates and a higher threshold is appropriate in areas underlain by more resistant bedrock. Climate
and bedrock resistance are two factors related to drainage density, i.e. the extent to which a landscape is
dissected by drainage channels.
The background value of the output raster (--output) will be the NoData value unless the --zero_background
flag is specified.
See Also: GreaterThan
Parameters:
| Flag | Description |
|---|---|
| --flow_accum | Input raster D8 flow accumulation file |
| -o, --output | Output raster file |
| --threshold | Threshold in flow accumulation values for channelization |
| --zero_background | Flag indicating whether a background value of zero should be used |
Python function:
wbt.extract_streams(
    flow_accum,
    output,
    threshold,
    zero_background=False,
    callback=default_callback
)
Command-line Interface:
>>./whitebox_tools -r=ExtractStreams -v --wd="/path/to/data/" ^
--flow_accum='d8accum.tif' -o='output.tif' --threshold=100.0 ^
--zero_background
Author: Dr. John Lindsay
Created: 28/06/2017
Last Modified: 30/01/2020
ExtractValleys
This tool can be used to extract channel networks from an input digital elevation models (--dem) using
one of three techniques that are based on local topography alone.
The Lindsay (2006) 'lower-quartile' method (--variant='LQ') algorithm is a type of 'valley recognition'
method. Other channel mapping methods, such as the Johnston and Rosenfeld (1975) algorithm, experience
problems because channel profiles are not always 'v'-shaped, nor are they always apparent in small
3 x 3 windows. The lower-quartile method was developed as an alternative and more flexible valley
recognition channel mapping technique. The lower-quartile method operates by running a filter over the
DEM that calculates the percentile value of the centre cell with respect to the distribution of
elevations within the filter window. The roving window is circular, the diameter of which should reflect
the topographic variation of the area (e.g. the channel width or average hillslope length). If this variant
is selected, the user must specify the filter size (--filter), in pixels, and this value should be an odd
number (e.g. 3, 5, 7, etc.). The appropriateness of the selected window diameter will depend on the grid
resolution relative to the scale of topographic features. Cells that are within the lower quartile of the
distribution of elevations of their neighbourhood are flagged. Thus, the algorithm identifies grid cells
that are in relatively low topographic positions at a local scale. This approach to channel mapping is only
appropriate in fluvial landscapes. In regions containing numerous lakes and wetlands, the algorithm will
pick out the edges of features.
The Johnston and Rosenfeld (1975) algorithm (--variant='JandR') is a type of 'valley recognition' method
and operates as follows: channel cells are flagged in a 3 x 3 window if the north and south neighbours are
higher than the centre grid cell or if the east and west neighbours meet this same criterion. The group of
cells that are flagged after one pass of the roving window constituted the drainage network. This method is
best applied to DEMs that are relatively smooth and do not exhibit high levels of short-range roughness. As
such, it may be desirable to use a smoothing filter before applying this tool. The FeaturePreservingSmoothing
is a good option for removing DEM roughness while preserving the topographic information contain in
breaks-in-slope (i.e. edges).
The Peucker and Douglas (1975) algorithm (--variant='PandD') is one of the simplest and earliest algorithms
for topography-based network extraction. Their 'valley recognition' method operates by passing a 2 x 2 roving
window over a DEM and flagging the highest grid cell in each group of four. Once the window has passed over
the entire DEM, channel grid cells are left unflagged. This method is also best applied to DEMs that are relatively
smooth and do not exhibit high levels of short-range roughness. Pre-processing the DEM with the FeaturePreservingSmoothing
tool may also be useful when applying this method.
Each of these methods of extracting valley networks result in line networks that can be wider than a single
grid cell. As such, it is often desirable to thin the resulting network using a line-thinning algorithm.
The option to perform line-thinning is provided by the tool as a post-processing step (--line_thin).
References:
Johnston, E. G., & Rosenfeld, A. (1975). Digital detection of pits, peaks, ridges, and ravines. IEEE Transactions on Systems, Man, and Cybernetics, (4), 472-480.
Lindsay, J. B. (2006). Sensitivity of channel mapping techniques to uncertainty in digital elevation data. International Journal of Geographical Information Science, 20(6), 669-692.
Peucker, T. K., & Douglas, D. H. (1975). Detection of surface-specific points by local parallel processing of discrete terrain elevation data. Computer Graphics and image processing, 4(4), 375-387.
See Also: FeaturePreservingSmoothing
Parameters:
| Flag | Description |
|---|---|
| --dem | Input raster DEM file |
| -o, --output | Output raster file |
| --variant | Options include 'LQ' (lower quartile), 'JandR' (Johnston and Rosenfeld), and 'PandD' (Peucker and Douglas); default is 'LQ' |
| --line_thin | Optional flag indicating whether post-processing line-thinning should be performed |
| --filter | Optional argument (only used when variant='lq') providing the filter size, in grid cells, used for lq-filtering (default is 5) |
Python function:
wbt.extract_valleys(
    dem,
    output,
    variant="LQ",
    line_thin=True,
    filter=5,
    callback=default_callback
)
Command-line Interface:
>>./whitebox_tools -r=ExtractValleys -v --wd="/path/to/data/" ^
--dem=pointer.tif -o=out.tif --variant='JandR' ^
--line_thin
>>./whitebox_tools -r=ExtractValleys -v ^
--wd="/path/to/data/" --dem=pointer.tif -o=out.tif ^
--variant='lq' --filter=7 --line_thin
Author: Dr. John Lindsay
Created: 12/07/2017
Last Modified: 30/01/2020
FarthestChannelHead
This tool calculates the upstream distance to the farthest stream head for each grid cell belonging to a
raster stream network. The user must specify the name of a raster containing streams data (--streams), where
stream grid cells are denoted by all positive non-zero values, and a D8 flow pointer (i.e. flow direction) raster
(--d8_pntr). The pointer image is used to traverse the stream network and must only be created using the D8 algorithm.
Stream cells are designated in the streams image as all values
greater than zero. Thus, all non-stream or background grid cells are commonly assigned either zeros or NoData
values. Background cells will be assigned the NoData value in the output image, unless the --zero_background
parameter is used, in which case non-stream cells will be assigned zero values in the output.
By default, the pointer raster is assumed to use the clockwise indexing method used by WhiteboxTools.
If the pointer file contains ESRI flow direction values instead, the --esri_pntr parameter must be specified.
See Also: LengthOfUpstreamChannels, FindMainStem
Parameters:
| Flag | Description |
|---|---|
| --d8_pntr | Input raster D8 pointer file |
| --streams | Input raster streams file |
| -o, --output | Output raster file |
| --esri_pntr | D8 pointer uses the ESRI style scheme |
| --zero_background | Flag indicating whether a background value of zero should be used |
Python function:
wbt.farthest_channel_head(
    d8_pntr,
    streams,
    output,
    esri_pntr=False,
    zero_background=False,
    callback=default_callback
)
Command-line Interface:
>>./whitebox_tools -r=FarthestChannelHead -v ^
--wd="/path/to/data/" --d8_pntr=D8.tif --streams=streams.tif ^
-o=output.tif
>>./whitebox_tools -r=FarthestChannelHead -v ^
--wd="/path/to/data/" --d8_pntr=D8.tif --streams=streams.tif ^
-o=output.tif --esri_pntr --zero_background
Author: Dr. John Lindsay
Created: 12/07/2017
Last Modified: 18/10/2019
FindMainStem
This tool can be used to identify the main channel in a stream network. The user must specify the names of
a D8 pointer (flow direction) raster (--d8_pntr), and a streams raster (--streams). The pointer raster
is used to traverse the stream network and should only be created using the D8Pointer. By default, the pointer
raster is assumed to use the clockwise indexing method used by WhiteboxTools:
| . | . | . |
|---|---|---|
| 64 | 128 | 1 |
| 32 | 0 | 2 |
| 16 | 8 | 4 |
If the pointer file contains ESRI flow direction values instead, the --esri_pntr parameter must be specified.
The streams raster should have been created using one of the DEM-based stream mapping methods, i.e. contributing
area thresholding. Stream grid cells are designated in the streams image as all positive, non-zero values. All
non-stream cells will be assigned the NoData value in the output image, unless the --zero_background parameter
is specified.
The algorithm operates by traversing each stream and identifying the longest stream-path draining to each outlet. When a confluence is encountered, the traverse follows the branch with the larger distance-to-head.
See Also: D8Pointer
Parameters:
| Flag | Description |
|---|---|
| --d8_pntr | Input raster D8 pointer file |
| --streams | Input raster streams file |
| -o, --output | Output raster file |
| --esri_pntr | D8 pointer uses the ESRI style scheme |
| --zero_background | Flag indicating whether a background value of zero should be used |
Python function:
wbt.find_main_stem(
    d8_pntr,
    streams,
    output,
    esri_pntr=False,
    zero_background=False,
    callback=default_callback
)
Command-line Interface:
>>./whitebox_tools -r=FindMainStem -v --wd="/path/to/data/" ^
--d8_pntr=D8.tif --streams=streams.tif ^
-o=output.tif
>>./whitebox_tools -r=FindMainStem -v ^
--wd="/path/to/data/" --d8_pntr=D8.tif --streams=streams.tif ^
-o=output.tif --esri_pntr --zero_background
Author: Dr. John Lindsay
Created: 27/06/2017
Last Modified: 18/10/2019
HackStreamOrder
This tool can be used to assign the Hack stream order to each link in a stream network. According to this common stream numbering system, the main stream is assigned an order of one. All tributaries to the main stream (i.e. the trunk) are assigned an order of two; tributaries to second-order links are assigned an order of three, and so on. The trunk or main stream of the stream network can be defined either based on the furthest upstream distance, at each bifurcation (i.e. network junction).
Stream order is often used in hydro-geomorphic and ecological studies to quantify the relative size and importance of a stream segment to the overall river system. Unlike some other stream ordering systems, e.g. Horton-Strahler stream order (StrahlerStreamOrder) and Shreve's stream magnitude (ShreveStreamMagnitude), Hack's stream ordering method increases from the catchment outlet towards the channel heads. This has the main advantage that the catchment outlet is likely to be accurately located while the channel network extent may be less accurately mapped.
The user must specify the names of a streams raster image (--streams) and D8 pointer image (--d8_pntr). Stream cells
are designated in the streams image as all positive, nonzero values. Thus all non-stream or background grid cells are
commonly assigned either zeros or NoData values. The pointer image is used to traverse the stream network and should only
be created using the D8 algorithm. Background cells will be assigned the NoData value in the output image, unless the
--zero_background parameter is used, in which case non-stream cells will be assigned zero values in the output.
By default, the pointer raster is assumed to use the clockwise indexing method used by WhiteboxTools.
If the pointer file contains ESRI flow direction values instead, the --esri_pntr parameter must be specified.
Reference:
Hack, J. T. (1957). Studies of longitudinal stream profiles in Virginia and Maryland (Vol. 294). US Government Printing Office.
See Also: HortonStreamOrder, StrahlerStreamOrder, ShreveStreamMagnitude, TopologicalStreamOrder
Parameters:
| Flag | Description |
|---|---|
| --d8_pntr | Input raster D8 pointer file |
| --streams | Input raster streams file |
| -o, --output | Output raster file |
| --esri_pntr | D8 pointer uses the ESRI style scheme |
| --zero_background | Flag indicating whether a background value of zero should be used |
Python function:
wbt.hack_stream_order(
    d8_pntr,
    streams,
    output,
    esri_pntr=False,
    zero_background=False,
    callback=default_callback
)
Command-line Interface:
>>./whitebox_tools -r=HackStreamOrder -v ^
--wd="/path/to/data/" --d8_pntr=D8.tif --streams=streams.tif ^
-o=output.tif
>>./whitebox_tools -r=HackStreamOrder -v ^
--wd="/path/to/data/" --d8_pntr=D8.tif --streams=streams.tif ^
-o=output.tif --esri_pntr --zero_background
Author: Dr. John Lindsay
Created: 25/06/2017
Last Modified: 18/10/2019
HortonStreamOrder
This tool can be used to assign the Horton stream order to each link in a stream network. Stream ordering is often used in hydro-geomorphic and ecological studies to quantify the relative size and importance of a stream segment to the overall river system. There are several competing stream ordering schemes. Based on to this common stream numbering system, headwater stream links are assigned an order of one. Stream order only increases downstream when two links of equal order join, otherwise the downstream link is assigned the larger of the two link orders.
Strahler order and Horton order are similar approaches to assigning stream network hierarchy. Horton stream order essentially starts with the Strahler order scheme, but subsequently replaces each of the assigned stream order value along the main trunk of the network with the order value of the outlet. The main channel is not treated differently compared with other tributaries in the Strahler ordering scheme.
The user must specify the names of a streams raster image (--streams) and D8 pointer image (--d8_pntr). Stream cells
are designated in the streams image as all positive, nonzero values. Thus all non-stream or background grid cells are
commonly assigned either zeros or NoData values. The pointer image is used to traverse the stream network and should only
be created using the D8 algorithm (D8Pointer). Background cells will be assigned the NoData value in the output image, unless the
--zero_background parameter is used, in which case non-stream cells will be assigned zero values in the output.
By default, the pointer raster is assumed to use the clockwise indexing method used by WhiteboxTools.
If the pointer file contains ESRI flow direction values instead, the --esri_pntr parameter must be specified.
Reference:
Horton, R. E. (1945). Erosional development of streams and their drainage basins; hydrophysical approach to quantitative morphology. Geological society of America bulletin, 56(3), 275-370.
See Also: HackStreamOrder, ShreveStreamMagnitude, StrahlerStreamOrder, TopologicalStreamOrder
Parameters:
| Flag | Description |
|---|---|
| --d8_pntr | Input raster D8 pointer file |
| --streams | Input raster streams file |
| -o, --output | Output raster file |
| --esri_pntr | D8 pointer uses the ESRI style scheme |
| --zero_background | Flag indicating whether a background value of zero should be used |
Python function:
wbt.horton_stream_order(
    d8_pntr,
    streams,
    output,
    esri_pntr=False,
    zero_background=False,
    callback=default_callback
)
Command-line Interface:
>>./whitebox_tools -r=HortonStreamOrder -v ^
--wd="/path/to/data/" --d8_pntr=D8.tif --streams=streams.tif ^
-o=output.tif
>>./whitebox_tools -r=HortonStreamOrder -v ^
--wd="/path/to/data/" --d8_pntr=D8.tif --streams=streams.tif ^
-o=output.tif --esri_pntr --zero_background
Author: Dr. John Lindsay
Created: 25/06/2017
Last Modified: 18/10/2019
LengthOfUpstreamChannels
This tool calculates, for each stream grid cell in an input streams raster (--streams) the
total length of channels upstream. The user must specify the name of a raster containing streams data (--streams), where
stream grid cells are denoted by all positive non-zero values, and a D8 flow pointer (i.e. flow direction) raster
(--d8_pntr). The pointer image is used to traverse the stream network and must only be created using the D8 algorithm.
Stream cells are designated in the streams image as all values greater than zero. Thus, all non-stream or background
grid cells are commonly assigned either zeros or NoData values. Background cells will be assigned the NoData value
in the output image, unless the --zero_background parameter is used, in which case non-stream cells will be assigned
zero values in the output.
By default, the pointer raster is assumed to use the clockwise indexing method used by WhiteboxTools.
If the pointer file contains ESRI flow direction values instead, the --esri_pntr parameter must be specified.
See Also: FarthestChannelHead, FindMainStem
Parameters:
| Flag | Description |
|---|---|
| --d8_pntr | Input raster D8 pointer file |
| --streams | Input raster streams file |
| -o, --output | Output raster file |
| --esri_pntr | D8 pointer uses the ESRI style scheme |
| --zero_background | Flag indicating whether a background value of zero should be used |
Python function:
wbt.length_of_upstream_channels(
    d8_pntr,
    streams,
    output,
    esri_pntr=False,
    zero_background=False,
    callback=default_callback
)
Command-line Interface:
>>./whitebox_tools -r=LengthOfUpstreamChannels -v ^
--wd="/path/to/data/" --d8_pntr=D8.tif --streams=streams.tif ^
-o=output.tif
>>./whitebox_tools -r=LengthOfUpstreamChannels -v ^
--wd="/path/to/data/" --d8_pntr=D8.tif --streams=streams.tif ^
-o=output.tif --esri_pntr --zero_background
Author: Dr. John Lindsay
Created: 11/07/2017
Last Modified: 18/10/2019
LongProfile
This tool can be used to create a longitudinal profile plot. A longitudinal stream profile is a plot of elevation against downstream distance. Most long profiles use distance from channel head as the distance measure. This tool, however, uses the distance to the stream network outlet cell, or mouth, as the distance measure. The reason for this difference is that while for any one location within a stream network there is only ever one downstream outlet, there is usually many upstream channel heads. Thus plotted using the traditional downstream-distance method, the same point within a network will plot in many different long profile locations, whereas it will always plot on one unique location in the distance-to-mouth method. One consequence of this difference is that the long profile will be oriented from right-to-left rather than left-to-right, as would traditionally be the case.
The tool outputs an interactive SVG line graph embedded in an HTML document (--output). The user must specify the
names of a D8 pointer (--d8_pntr) image (flow direction), a streams raster image
(--streams), and a digital elevation model (--dem). Stream cells are designated in the streams image as all
positive, nonzero values. Thus all non-stream or background grid cells are commonly assigned either zeros or NoData
values. The pointer image is used to traverse the stream network and should only be created using the D8 algorithm
(D8Pointer). The streams image should be derived using a flow accumulation based stream network extraction
algorithm, also based on the D8 flow algorithm.
By default, the pointer raster is assumed to use the clockwise indexing method used by WhiteboxTools.
If the pointer file contains ESRI flow direction values instead, the --esri_pntr parameter must be specified.
See Also: LongProfileFromPoints, Profile, D8Pointer
Parameters:
| Flag | Description |
|---|---|
| --d8_pntr | Input raster D8 pointer file |
| --streams | Input raster streams file |
| --dem | Input raster DEM file |
| -o, --output | Output HTML file |
| --esri_pntr | D8 pointer uses the ESRI style scheme |
Python function:
wbt.long_profile(
    d8_pntr,
    streams,
    dem,
    output,
    esri_pntr=False,
    callback=default_callback
)
Command-line Interface:
>>./whitebox_tools -r=LongProfile -v --wd="/path/to/data/" ^
--d8_pntr=D8.tif --streams=streams.tif --dem=dem.tif ^
-o=output.html --esri_pntr
Author: Dr. John Lindsay
Created: 20/02/2018
Last Modified: 18/10/2019
LongProfileFromPoints
This tool can be used to create a longitudinal profile plot
for a set of vector points (--points). A longitudinal stream profile is a plot of elevation against downstream
distance. Most long profiles use distance from channel head as the distance measure. This tool, however, uses the
distance to the outlet cell, or mouth, as the distance measure.
The tool outputs an interactive SVG line graph embedded in an HTML document (--output). The user must specify the
names of a D8 pointer (--d8_pntr) image (flow direction), a vector points file (--points), and a digital
elevation model (--dem). The pointer image is used to traverse the flow path issuing from each initiation point
in the vector file; this pointer file should only be created using the D8 algorithm (D8Pointer).
By default, the pointer raster is assumed to use the clockwise indexing method used by WhiteboxTools.
If the pointer file contains ESRI flow direction values instead, the --esri_pntr parameter must be specified.
See Also: LongProfile, Profile, D8Pointer
Parameters:
| Flag | Description |
|---|---|
| --d8_pntr | Input raster D8 pointer file |
| --points | Input vector points file |
| --dem | Input raster DEM file |
| -o, --output | Output HTML file |
| --esri_pntr | D8 pointer uses the ESRI style scheme |
Python function:
wbt.long_profile_from_points(
    d8_pntr,
    points,
    dem,
    output,
    esri_pntr=False,
    callback=default_callback
)
Command-line Interface:
>>./whitebox_tools -r=LongProfileFromPoints -v ^
--wd="/path/to/data/" --d8_pntr=D8.tif --points=stream_head.shp ^
--dem=dem.tif -o=output.html --esri_pntr
Author: Dr. John Lindsay
Created: 21/02/2018
Last Modified: 18/10/2019
PruneVectorStreams
Note this tool is part of a WhiteboxTools extension product. Please visit Whitebox Geospatial Inc. for information about purchasing a license activation key (https://www.whiteboxgeo.com/extension-pricing/).
This tool can be used to prune an input vector stream network (--streams), such that smaller headwater streams are removed
from the output vector streams file (--output). Streams are pruned based on their modelled size, which is estimated
using the tributary total upstream channel length (TUCL). TUCL is a measure of the upstream channel extent and therefore
the catchment area. A tributary always connects a channel head and a downstream confluence/outlet in the stream network. This
is in contrast to a stream link, which connects either a channel head and downstream confluence, in the case of headwater
streams, or two confluences, in the case of interior links. Tributaries are often composed of multiple stream links and
can have tributaries of their own. At each confluence in the stream network, the tributary identifier that carries on
downstream is associated with the upstream link with the larger TUCL value (a surrogate for stream/drainage area size). The
tool will determine TUCL and tributary structure by first performing a network analysis operation on the input vector
stream network. This requires knowledge of the elevation distribution among stream links, which is provided by an input
digital elevation model (DEM; --dem). The main purpose of the DEM is to distinguish between the the outlet stream link
and exterior (i.e. headwater) stream links in initiating the tree-traversal algorithm used in the stream network analysis
operation. Thus, the DEM need not be particularly fine-resolution.
The user must specify the --threshold tributary TUCL value, with larger values providing more extensive pruning. Because
the tool uses tributary TUCL, rather than stream-link TUCL, the resulting pruned stream network will contain fewer streams
but will preserve the spatially extent of the original network. That is, stream tributaries with TUCL values larger than the
specified threshold will maintain their full length all the way to their channel heads. The main channel stem of networks
will be preserved. User experimentation is likely required to determine an appropriate value for the threshold parameter,
which will also depend of the application. However, this value should not be larger than the TUCL of the main stem, or
else the output network will not contain any features. Tributary TUCL generally follows an exponential progression in
a stream network from headwater tributaries towards the main branch. To review the range of TUCL values within a network,
one may wish to apply the related VectorStreamNetworkAnalysis tool first, reviewing the TUCL values in the output
attribute table. Be mindful however that this is a stream-link TUCL value and not a tributary TUCL (which is why the
output of PruneVectorStreams cannot simply be replicated by thresholding the TUCL attribute output by
VectorStreamNetworkAnalysis) although the range of values will be the same.
The user must lastly specify the --snap distance value, in meters. This parameter allows the tool to identify the
linkage between stream segments when their end nodes are not perfectly aligned. One may also choose to run the
RepairStreamVectorTopology tool prior to this tool to resolve any misalignment in the input streams vector.
See Also: TopologicalBreachBurn, RepairStreamVectorTopology, VectorStreamNetworkAnalysis
Parameters:
| Flag | Description |
|---|---|
| --streams | Name of the input streams vector file |
| --dem | Name of the input DEM raster file |
| -o, --output | Name of the output lines shapefile |
| --threshold | Tributary upstream channel length threshold, in xy units (metres) |
| --snap | Snap distance, in xy units (metres) |
Python function:
wbt.prune_vector_streams(
    streams,
    dem,
    output,
    threshold="",
    snap=0.1,
    callback=default_callback
)
Command-line Interface:
>> ./whitebox_tools -r=PruneVectorStreams --streams=rivers.shp ^
--dem=DEM.tif -o=network_analysis.shp --snap=1.0
Source code is unavailable due to proprietary license.
Author: Whitebox Geospatial Inc. (c)
Created: 04/05/2023
Last Modified: 04/05/2023
RasterStreamsToVector
This tool converts a raster stream file into a vector file. The user must specify: 1)
the name of the raster streams file, 2) the name of the D8 flow pointer file,
and 3) the name of the output vector file. Streams in the input raster streams
file are denoted by cells containing any positive, non-zero integer. A field in
the vector database file, called STRM_VAL, will correspond to this positive
integer value. The database file will also have a field for the length of each
link in the stream network. The flow pointer file must be calculated from a DEM with
all topographic depressions and flat areas removed and must be calculated using the
D8 flow pointer algorithm. The output vector will contain PolyLine features. By default,
the tool will only maintain vertices in the output vector file where there is a change
in the downstream flow direction, which can result in a significant reduction in the
number of vertices in the output file, and therefore reduced file sizes. However, the
user can optionally override this behaviour by specifying the --all_vertices input
parameter. If specified, this parameter has the effect of presering all of the verticies
associated with grid cells in the input raster within the output vector file.
See Also: RasterizeStreams, RasterToVectorLines
Parameters:
| Flag | Description |
|---|---|
| --streams | Input raster streams file |
| --d8_pntr | Input raster D8 pointer file |
| -o, --output | Output vector file |
| --esri_pntr | D8 pointer uses the ESRI style scheme |
| --all_vertices | Do you want to preserve all vertices in output (i.e. no straight-line generalization) |
Python function:
wbt.raster_streams_to_vector(
    streams,
    d8_pntr,
    output,
    esri_pntr=False,
    all_vertices=False,
    callback=default_callback
)
Command-line Interface:
>>./whitebox_tools -r=RasterStreamsToVector -v ^
--wd="/path/to/data/" --streams=streams.tif --d8_pntr=D8.tif ^
-o=output.shp
>>./whitebox_tools -r=RasterStreamsToVector -v ^
--wd="/path/to/data/" --streams=streams.tif --d8_pntr=D8.tif ^
-o=output.shp --esri_pntr
Author: Dr. John Lindsay
Created: 24/09/2018
Last Modified: 18/10/2019
RasterizeStreams
This tool can be used rasterize an input vector stream network (--streams) using on Lindsay (2016) method.
The user must specify the name of an existing raster (--base), from which the output raster's grid resolution
is determined.
Reference:
Lindsay JB. 2016. The practice of DEM stream burning revisited. Earth Surface Processes and Landforms, 41(5): 658–668. DOI: 10.1002/esp.3888
See Also: RasterStreamsToVector
Parameters:
| Flag | Description |
|---|---|
| --streams | Input vector streams file |
| --base | Input base raster file |
| -o, --output | Output raster file |
| --nodata | Use NoData value for background? |
| --feature_id | Use feature number as output value? |
Python function:
wbt.rasterize_streams(
    streams,
    base,
    output,
    nodata=True,
    feature_id=False,
    callback=default_callback
)
Command-line Interface:
>>./whitebox_tools -r=RasterizeStreams -v ^
--wd="/path/to/data/" --streams=streams.shp --base=raster.tif ^
-o=output.tif
Author: Dr. John Lindsay
Created: 11/03/2018
Last Modified: 22/10/2019
RemoveShortStreams
This tool can be used to remove stream links in a stream network that are shorter than a user-specified length (--min_length).
The user must specify the names of a streams raster image (--streams) and D8 pointer image (--d8_pntr). Stream cells
are designated in the streams raster as all positive, nonzero values. Thus all non-stream or background grid cells are
commonly assigned either zeros or NoData values. The pointer raster is used to traverse the stream network and should only
be created using the D8 algorithm. Background cells will be assigned the NoData value in the output image, unless the
--zero_background parameter is used, in which case non-stream cells will be assigned zero values in the output.
By default, the pointer raster is assumed to use the clockwise indexing method used by WhiteboxTools.
If the pointer file contains ESRI flow direction values instead, the --esri_pntr parameter must be specified.
See Also: ExtractStreams
Parameters:
| Flag | Description |
|---|---|
| --d8_pntr | Input raster D8 pointer file |
| --streams | Input raster streams file |
| -o, --output | Output raster file |
| --min_length | Minimum tributary length (in map units) used for network pruning |
| --esri_pntr | D8 pointer uses the ESRI style scheme |
Python function:
wbt.remove_short_streams(
    d8_pntr,
    streams,
    output,
    min_length,
    esri_pntr=False,
    callback=default_callback
)
Command-line Interface:
>>./whitebox_tools -r=RemoveShortStreams -v ^
--wd="/path/to/data/" --d8_pntr=D8.tif --streams=streams.tif ^
-o=output.tif
Author: Dr. John Lindsay
Created: 28/06/2017
Last Modified: 30/01/2020
RepairStreamVectorTopology
This tool can be used to resolve many of the topological errors and inconsistencies associated with manually digitized vector stream networks, i.e. hydrography data. A properly structured stream network should consist of a series of stream segments that connect a channel head to a downstream confluence, or an upstream confluence to a downstream confluence/outlet. This tool will join vector arcs that connect at arbitrary, non-confluence points along stream segments. It also splits an arc where a tributary stream connects at a mid-point, thereby creating a proper confluence where two upstream triburaries converge into a downstream segment. The tool also handles non-connecting tributaries caused by dangling arcs, i.e. overshoots and undershoots.
The user may optionally specify the name of the input vector stream network (--input) and the output file
(--output). Note that if an input file is not specified by the user, the tool will search for all vector
files (*.shp) files contained within the current working directory. This feature can be very useful when
you need to process a large number of stream files contained within a single directory. The tool will
process the files in parallel in this batch mode.
A distance threshold for snapping dangling arcs (--snap) must be specified by the user. This distance
is in the input layer's x-y units. The tool works best on projected input
data, however, if the input are in geographic coordinates (latitude and longitude), then specifying a
small valued snap distance is advisable.
Additionally, the tool possesses two Boolean flags, --reverse_backward_arcs and --correct_nonconfluence_joins
which determine whether the tool will correct backward arcs (i.e., line segements that are oriented
in the reverse direction to the streamflow) and non-confluence joins (i.e., upstream/downstream line
segments that are not joined at confluence locations).
Notice that the attributes of the input layer will not be carried over to the output file because there is not a one-for-one feature correspondence between the two files due to the joins and splits of stream segments. Instead the output attribute table will only contain a feature ID (FID) entry.
Note: this tool should be used to pre-process vector streams that are input to the VectorStreamNetworkAnalysis tool.
See Also: VectorStreamNetworkAnalysis, FixDanglingArcs
Parameters:
| Flag | Description |
|---|---|
| -i, --input | Name of the input lines vector file |
| -o, --output | Name of the output lines vector file |
| --snap, --dist | Snap distance, in xy units (metres) |
Python function:
wbt.repair_stream_vector_topology(
    i,
    output,
    dist="",
    callback=default_callback
)
Command-line Interface:
>> ./whitebox_tools -r=RepairStreamVectorTopology ^
--input=streams.shp --output=streams_fixed.shp --snap=2.0
Source code is unavailable due to proprietary license.
Author: Prof. John Lindsay
Created: 03/08/2021 (oringinally in Whitebox Toolset Extension)
Last Modified: 04/11/2023
ShreveStreamMagnitude
This tool can be used to assign the Shreve stream magnitude to each link in a stream network. Stream ordering is often used in hydro-geomorphic and ecological studies to quantify the relative size and importance of a stream segment to the overall river system. There are several competing stream ordering schemes. Shreve stream magnitude is equal to the number of headwater links upstream of each link. Headwater stream links are assigned a magnitude of one.
The user must specify the names of a streams raster image (--streams) and D8 pointer image (--d8_pntr). Stream cells
are designated in the streams raster as all positive, nonzero values. Thus all non-stream or background grid cells are
commonly assigned either zeros or NoData values. The pointer image is used to traverse the stream network and should only
be created using the D8 algorithm. Background cells will be assigned the NoData value in the output image, unless the
--zero_background parameter is used, in which case non-stream cells will be assigned zero values in the output.
By default, the pointer raster is assumed to use the clockwise indexing method used by WhiteboxTools.
If the pointer file contains ESRI flow direction values instead, the --esri_pntr parameter must be specified.
Reference:
Shreve, R. L. (1966). Statistical law of stream numbers. The Journal of Geology, 74(1), 17-37.
See Also: HortonStreamOrder, HackStreamOrder, StrahlerStreamOrder, TopologicalStreamOrder
Parameters:
| Flag | Description |
|---|---|
| --d8_pntr | Input raster D8 pointer file |
| --streams | Input raster streams file |
| -o, --output | Output raster file |
| --esri_pntr | D8 pointer uses the ESRI style scheme |
| --zero_background | Flag indicating whether a background value of zero should be used |
Python function:
wbt.shreve_stream_magnitude(
    d8_pntr,
    streams,
    output,
    esri_pntr=False,
    zero_background=False,
    callback=default_callback
)
Command-line Interface:
>>./whitebox_tools -r=ShreveStreamMagnitude -v ^
--wd="/path/to/data/" --d8_pntr=D8.tif --streams=streams.tif ^
-o=output.tif
>>./whitebox_tools -r=ShreveStreamMagnitude -v ^
--wd="/path/to/data/" --d8_pntr=D8.tif --streams=streams.tif ^
-o=output.tif --esri_pntr --zero_background
Author: Dr. John Lindsay
Created: 28/06/2017
Last Modified: 18/10/2019
StrahlerStreamOrder
This tool can be used to assign the Strahler stream order to each link in a stream network. Stream ordering is often used in hydro-geomorphic and ecological studies to quantify the relative size and importance of a stream segment to the overall river system. There are several competing stream ordering schemes. Based on to this common stream numbering system, headwater stream links are assigned an order of one. Stream order only increases downstream when two links of equal order join, otherwise the downstream link is assigned the larger of the two link orders.
Strahler order and Horton order are similar approaches to assigning stream network hierarchy. Horton stream order essentially starts with the Strahler order scheme, but subsequently replaces each of the assigned stream order value along the main trunk of the network with the order value of the outlet. The main channel is not treated differently compared with other tributaries in the Strahler ordering scheme.
The user must specify the names of a streams raster image (--streams) and D8 pointer image (--d8_pntr). Stream cells
are designated in the streams image as all positive, nonzero values. Thus all non-stream or background grid cells are
commonly assigned either zeros or NoData values. The pointer image is used to traverse the stream network and should only
be created using the D8 algorithm. Background cells will be assigned the NoData value in the output image, unless the
--zero_background parameter is used, in which case non-stream cells will be assigned zero values in the output.
By default, the pointer raster is assumed to use the clockwise indexing method used by WhiteboxTools.
If the pointer file contains ESRI flow direction values instead, the --esri_pntr parameter must be specified.
Reference:
Strahler, A. N. (1957). Quantitative analysis of watershed geomorphology. Eos, Transactions American Geophysical Union, 38(6), 913-920.
See Also: HortonStreamOrder, HackStreamOrder, ShreveStreamMagnitude, TopologicalStreamOrder
Parameters:
| Flag | Description |
|---|---|
| --d8_pntr | Input raster D8 pointer file |
| --streams | Input raster streams file |
| -o, --output | Output raster file |
| --esri_pntr | D8 pointer uses the ESRI style scheme |
| --zero_background | Flag indicating whether a background value of zero should be used |
Python function:
wbt.strahler_stream_order(
    d8_pntr,
    streams,
    output,
    esri_pntr=False,
    zero_background=False,
    callback=default_callback
)
Command-line Interface:
>>./whitebox_tools -r=StrahlerStreamOrder -v ^
--wd="/path/to/data/" --d8_pntr=D8.tif --streams=streams.tif ^
-o=output.tif
>>./whitebox_tools -r=StrahlerStreamOrder -v ^
--wd="/path/to/data/" --d8_pntr=D8.tif --streams=streams.tif ^
-o=output.tif --esri_pntr --zero_background
Author: Dr. John Lindsay
Created: 25/06/2017
Last Modified: 18/10/2019
StreamLinkClass
This tool identifies all interior and exterior links, and source, link, and sink nodes in an input stream network
(--streams). The input streams file is used to designate which grid cells contain a stream and the pointer
image is used to traverse the stream network. Stream cells are designated in the streams image as all values
greater than zero. Thus, all non-stream or background grid cells are commonly assigned either zeros or NoData
values. Background cells will be assigned the NoData value in the output image, unless the --zero_background
parameter is used, in which case non-stream cells will be assigned zero values in the output.
Each feature is assigned the following identifier in the output image:
| Value | Stream Type |
|---|---|
| 1 | Exterior Link |
| 2 | Interior Link |
| 3 | Source Node (head water) |
| 4 | Link Node |
| 5 | Sink Node |
The user must specify the names of an input stream file, a pointer (flow direction) file (--d8_pntr)
and the output raster file (--output). The flow pointer and streams rasters should be generated
using the D8Pointer algorithm. This will require a depressionless DEM, processed using either the
BreachDepressions or FillDepressions tool. flow direction) raster, and the output raster.
By default, the pointer raster is assumed to use the clockwise indexing method used by WhiteboxTools.
If the pointer file contains ESRI flow direction values instead, the --esri_pntr parameter must be specified.
See Also: StreamLinkIdentifier
Parameters:
| Flag | Description |
|---|---|
| --d8_pntr | Input raster D8 pointer file |
| --streams | Input raster streams file |
| -o, --output | Output raster file |
| --esri_pntr | D8 pointer uses the ESRI style scheme |
| --zero_background | Flag indicating whether a background value of zero should be used |
Python function:
wbt.stream_link_class(
    d8_pntr,
    streams,
    output,
    esri_pntr=False,
    zero_background=False,
    callback=default_callback
)
Command-line Interface:
>>./whitebox_tools -r=StreamLinkClass -v ^
--wd="/path/to/data/" --d8_pntr=D8.tif --streams=streams.tif ^
-o=output.tif
>>./whitebox_tools -r=StreamLinkClass -v ^
--wd="/path/to/data/" --d8_pntr=D8.tif --streams=streams.tif ^
-o=output.tif --esri_pntr --zero_background
Author: Dr. John Lindsay
Created: 12/07/2017
Last Modified: 10/10/2019
StreamLinkIdentifier
This tool can be used to assign each link in a stream network a unique numeric identifier. This grid is used by a number of other stream network analysis tools.
The input streams file (--streams) is used to designate which grid cells contain a stream and the pointer
image is used to traverse the stream network. Stream cells are designated in the streams image as all values
greater than zero. Thus, all non-stream or background grid cells are commonly assigned either zeros or NoData
values. Background cells will be assigned the NoData value in the output image, unless the --zero_background
parameter is used, in which case non-stream cells will be assigned zero values in the output.
The user must specify the name of a flow pointer (flow direction) raster (--d8_pntr), a streams raster
(--streams), and the output raster (--output). The flow pointer and streams rasters should be generated
using the D8Pointer algorithm. This will require a depressionless DEM, processed using either the
BreachDepressions or FillDepressions tool.
By default, the pointer raster is assumed to use the clockwise indexing method used by WhiteboxTools.
If the pointer file contains ESRI flow direction values instead, the --esri_pntr parameter must be specified.
See Also: D8Pointer, TributaryIdentifier, BreachDepressions, FillDepressions
Parameters:
| Flag | Description |
|---|---|
| --d8_pntr | Input raster D8 pointer file |
| --streams | Input raster streams file |
| -o, --output | Output raster file |
| --esri_pntr | D8 pointer uses the ESRI style scheme |
| --zero_background | Flag indicating whether a background value of zero should be used |
Python function:
wbt.stream_link_identifier(
    d8_pntr,
    streams,
    output,
    esri_pntr=False,
    zero_background=False,
    callback=default_callback
)
Command-line Interface:
>>./whitebox_tools -r=StreamLinkIdentifier -v ^
--wd="/path/to/data/" --d8_pntr=D8.tif --streams=streams.tif ^
-o=output.tif
>>./whitebox_tools -r=StreamLinkIdentifier -v ^
--wd="/path/to/data/" --d8_pntr=D8.tif --streams=streams.tif ^
-o=output.tif --esri_pntr --zero_background
Author: Dr. John Lindsay
Created: 25/06/2017
Last Modified: 03/09/2020
StreamLinkLength
This tool can be used to measure the length of each link in a stream network. The user must specify the names of
a stream link ID raster (--linkid), created using the StreamLinkIdentifier and D8 pointer raster (--d8_pntr).
The flow pointer raster is used to traverse the stream network and should only be created using the D8Pointer algorithm.
Stream cells are designated in the stream link ID raster as all non-zero, positive values. Background cells will be
assigned the NoData value in the output image, unless the --zero_background parameter is used, in which case non-stream
cells will be assigned zero values in the output.
See Also: D8Pointer, StreamLinkSlope
Parameters:
| Flag | Description |
|---|---|
| --d8_pntr | Input raster D8 pointer file |
| --linkid | Input raster streams link ID (or tributary ID) file |
| -o, --output | Output raster file |
| --esri_pntr | D8 pointer uses the ESRI style scheme |
| --zero_background | Flag indicating whether a background value of zero should be used |
Python function:
wbt.stream_link_length(
    d8_pntr,
    linkid,
    output,
    esri_pntr=False,
    zero_background=False,
    callback=default_callback
)
Command-line Interface:
>>./whitebox_tools -r=StreamLinkLength -v ^
--wd="/path/to/data/" --d8_pntr=D8.tif --linkid=streamsID.tif ^
--dem=dem.tif -o=output.tif
>>./whitebox_tools ^
-r=StreamLinkLength -v --wd="/path/to/data/" --d8_pntr=D8.tif ^
--linkid=streamsID.tif --dem=dem.tif -o=output.tif --esri_pntr ^
--zero_background
Author: Dr. John Lindsay
Created: 27/06/2017
Last Modified: 18/10/2019
StreamLinkSlope
This tool can be used to measure the average slope gradient, in percent, of each link in a raster stream
network. To estimate the slope of individual grid cells in a raster stream network, use the
StreamSlopeContinuous tool instead. The user must specify the names of a stream link identifier raster image (--linkid), a D8
pointer image (--d8_pntr), and a digital elevation model (--dem). The pointer image is used to traverse the
stream network and must only be created using the D8 algorithm (D8Pointer).
Stream cells are designated in the streams image as all values greater than zero. Thus, all non-stream or background
grid cells are commonly assigned either zeros or NoData values. Background cells will be assigned the NoData value
in the output image, unless the --zero_background parameter is used, in which case non-stream cells will be assigned
zero values in the output.
By default, the pointer raster is assumed to use the clockwise indexing method used by WhiteboxTools.
If the pointer file contains ESRI flow direction values instead, the --esri_pntr parameter must be specified.
See Also: StreamSlopeContinuous, D8Pointer
Parameters:
| Flag | Description |
|---|---|
| --d8_pntr | Input raster D8 pointer file |
| --linkid | Input raster streams link ID (or tributary ID) file |
| -i, --dem | Input raster DEM file |
| -o, --output | Output raster file |
| --esri_pntr | D8 pointer uses the ESRI style scheme |
| --zero_background | Flag indicating whether a background value of zero should be used |
Python function:
wbt.stream_link_slope(
    d8_pntr,
    linkid,
    dem,
    output,
    esri_pntr=False,
    zero_background=False,
    callback=default_callback
)
Command-line Interface:
>>./whitebox_tools -r=StreamLinkSlope -v ^
--wd="/path/to/data/" --d8_pntr=D8.tif --linkid=streamsID.tif ^
--dem=dem.tif -o=output.tif
>>./whitebox_tools ^
-r=StreamLinkSlope -v --wd="/path/to/data/" --d8_pntr=D8.tif ^
--linkid=streamsID.tif --dem=dem.tif -o=output.tif --esri_pntr ^
--zero_background
Author: Dr. John Lindsay
Created: 27/06/2017
Last Modified: 18/10/2019
StreamSlopeContinuous
This tool can be used to measure the slope gradient, in degrees, each grid cell in a raster stream network. To
estimate the average slope for each link in a stream network, use the
StreamLinkSlope tool instead. The user must specify the names of a stream raster image (--streams), a D8
pointer image (--d8_pntr), and a digital elevation model (--dem). The pointer image is used to traverse the
stream network and must only be created using the D8 algorithm (D8Pointer).
Stream cells are designated in the streams image as all values greater than zero. Thus, all non-stream or background
grid cells are commonly assigned either zeros or NoData values. Background cells will be assigned the NoData value
in the output image, unless the --zero_background parameter is used, in which case non-stream cells will be assigned
zero values in the output.
By default, the pointer raster is assumed to use the clockwise indexing method used by WhiteboxTools.
If the pointer file contains ESRI flow direction values instead, the --esri_pntr parameter must be specified.
See Also: StreamLinkSlope, D8Pointer
Parameters:
| Flag | Description |
|---|---|
| --d8_pntr | Input raster D8 pointer file |
| --streams | Input raster streams file |
| -i, --dem | Input raster DEM file |
| -o, --output | Output raster file |
| --esri_pntr | D8 pointer uses the ESRI style scheme |
| --zero_background | Flag indicating whether a background value of zero should be used |
Python function:
wbt.stream_slope_continuous(
    d8_pntr,
    streams,
    dem,
    output,
    esri_pntr=False,
    zero_background=False,
    callback=default_callback
)
Command-line Interface:
>>./whitebox_tools -r=StreamSlopeContinuous -v ^
--wd="/path/to/data/" --d8_pntr=D8.tif --linkid=streamsID.tif ^
--dem=dem.tif -o=output.tif
>>./whitebox_tools ^
-r=StreamSlopeContinuous -v --wd="/path/to/data/" ^
--d8_pntr=D8.tif --streams=streamsID.tif --dem=dem.tif ^
-o=output.tif --esri_pntr --zero_background
Author: Dr. John Lindsay
Created: 06/07/2017
Last Modified: 18/10/2019
TopologicalStreamOrder
This tool can be used to assign the topological stream order to each link in a stream network. According to this stream numbering system, the link directly draining to the outlet is assigned an order of one. Each of the two tributaries draining to the order-one link are assigned an order of two, and so on until the most distant link from the catchment outlet has been assigned an order. The topological order can therefore be thought of as a measure of the topological distance of each link in the network to the catchment outlet and is likely to be related to travel time.
The user must specify the names of a streams raster image (--streams) and D8 pointer image (--d8_pntr). Stream cells
are designated in the streams image as all positive, nonzero values. Thus all non-stream or background grid cells are
commonly assigned either zeros or NoData values. The pointer image is used to traverse the stream network and should only
be created using the D8 algorithm. Background cells will be assigned the NoData value in the output image, unless the
--zero_background parameter is used, in which case non-stream cells will be assigned zero values in the output.
By default, the pointer raster is assumed to use the clockwise indexing method used by WhiteboxTools.
If the pointer file contains ESRI flow direction values instead, the --esri_pntr parameter must be specified.
See Also: HackStreamOrder, HortonStreamOrder, StrahlerStreamOrder, ShreveStreamMagnitude
Parameters:
| Flag | Description |
|---|---|
| --d8_pntr | Input raster D8 pointer file |
| --streams | Input raster streams file |
| -o, --output | Output raster file |
| --esri_pntr | D8 pointer uses the ESRI style scheme |
| --zero_background | Flag indicating whether a background value of zero should be used |
Python function:
wbt.topological_stream_order(
    d8_pntr,
    streams,
    output,
    esri_pntr=False,
    zero_background=False,
    callback=default_callback
)
Command-line Interface:
>>./whitebox_tools -r=TopologicalStreamOrder -v ^
--wd="/path/to/data/" --d8_pntr=D8.tif --streams=streams.tif ^
-o=output.tif
>>./whitebox_tools -r=TopologicalStreamOrder -v ^
--wd="/path/to/data/" --d8_pntr=D8.tif --streams=streams.tif ^
-o=output.tif --esri_pntr --zero_background
Author: Dr. John Lindsay
Created: 28/06/2017
Last Modified: 18/10/2019
TributaryIdentifier
This tool can be used to assigns a unique identifier to each tributary in a stream network. A tributary is a section of a stream network extending from a channel head downstream to a confluence with a larger stream. Relative stream size is estimated using stream length as a surrogate. Tributaries therefore extend from channel heads downstream until a confluence is encountered in which the intersecting stream is longer, or an outlet cell is detected.
The input streams file (--streams) is used to designate which grid cells contain a stream and the pointer
image is used to traverse the stream network. Stream cells are designated in the streams image as all values
greater than zero. Thus, all non-stream or background grid cells are commonly assigned either zeros or NoData
values. Background cells will be assigned the NoData value in the output image, unless the --zero_background
parameter is used, in which case non-stream cells will be assigned zero values in the output.
The user must specify the name of a flow pointer (flow direction) raster (--d8_pntr), a streams raster
(--streams), and the output raster (--output). The flow pointer and streams rasters should be generated
using the D8Pointer algorithm. This will require a depressionless DEM, processed using either the
BreachDepressions or FillDepressions tool. flow direction) raster, and the output raster.
By default, the pointer raster is assumed to use the clockwise indexing method used by WhiteboxTools.
If the pointer file contains ESRI flow direction values instead, the --esri_pntr parameter must be specified.
See Also: D8Pointer, StreamLinkIdentifier, BreachDepressions, FillDepressions
Parameters:
| Flag | Description |
|---|---|
| --d8_pntr | Input raster D8 pointer file |
| --streams | Input raster streams file |
| -o, --output | Output raster file |
| --esri_pntr | D8 pointer uses the ESRI style scheme |
| --zero_background | Flag indicating whether a background value of zero should be used |
Python function:
wbt.tributary_identifier(
    d8_pntr,
    streams,
    output,
    esri_pntr=False,
    zero_background=False,
    callback=default_callback
)
Command-line Interface:
>>./whitebox_tools -r=TributaryIdentifier -v ^
--wd="/path/to/data/" --d8_pntr=D8.tif --streams=streams.tif ^
-o=output.tif
>>./whitebox_tools -r=TributaryIdentifier -v ^
--wd="/path/to/data/" --d8_pntr=D8.tif --streams=streams.tif ^
-o=output.tif --esri_pntr --zero_background
Author: Dr. John Lindsay
Created: 25/06/2017
Last Modified: 10/10/2019
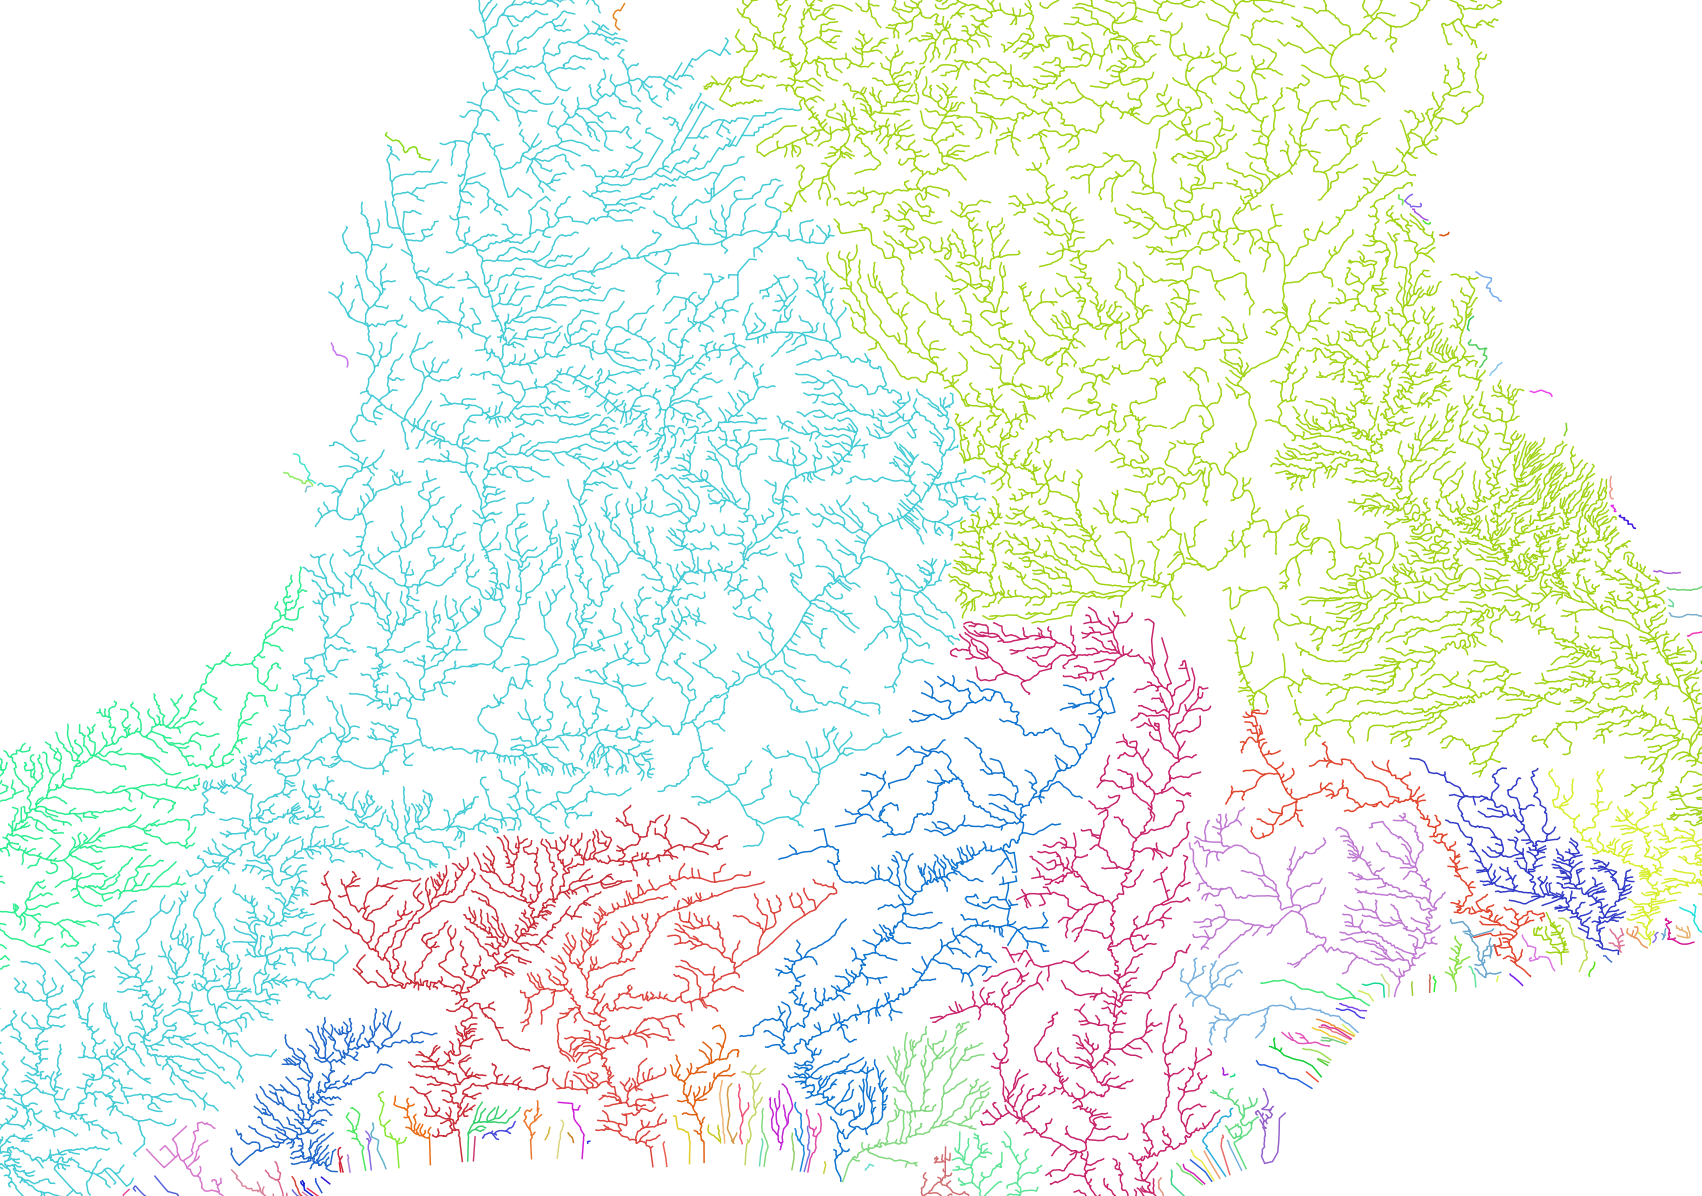
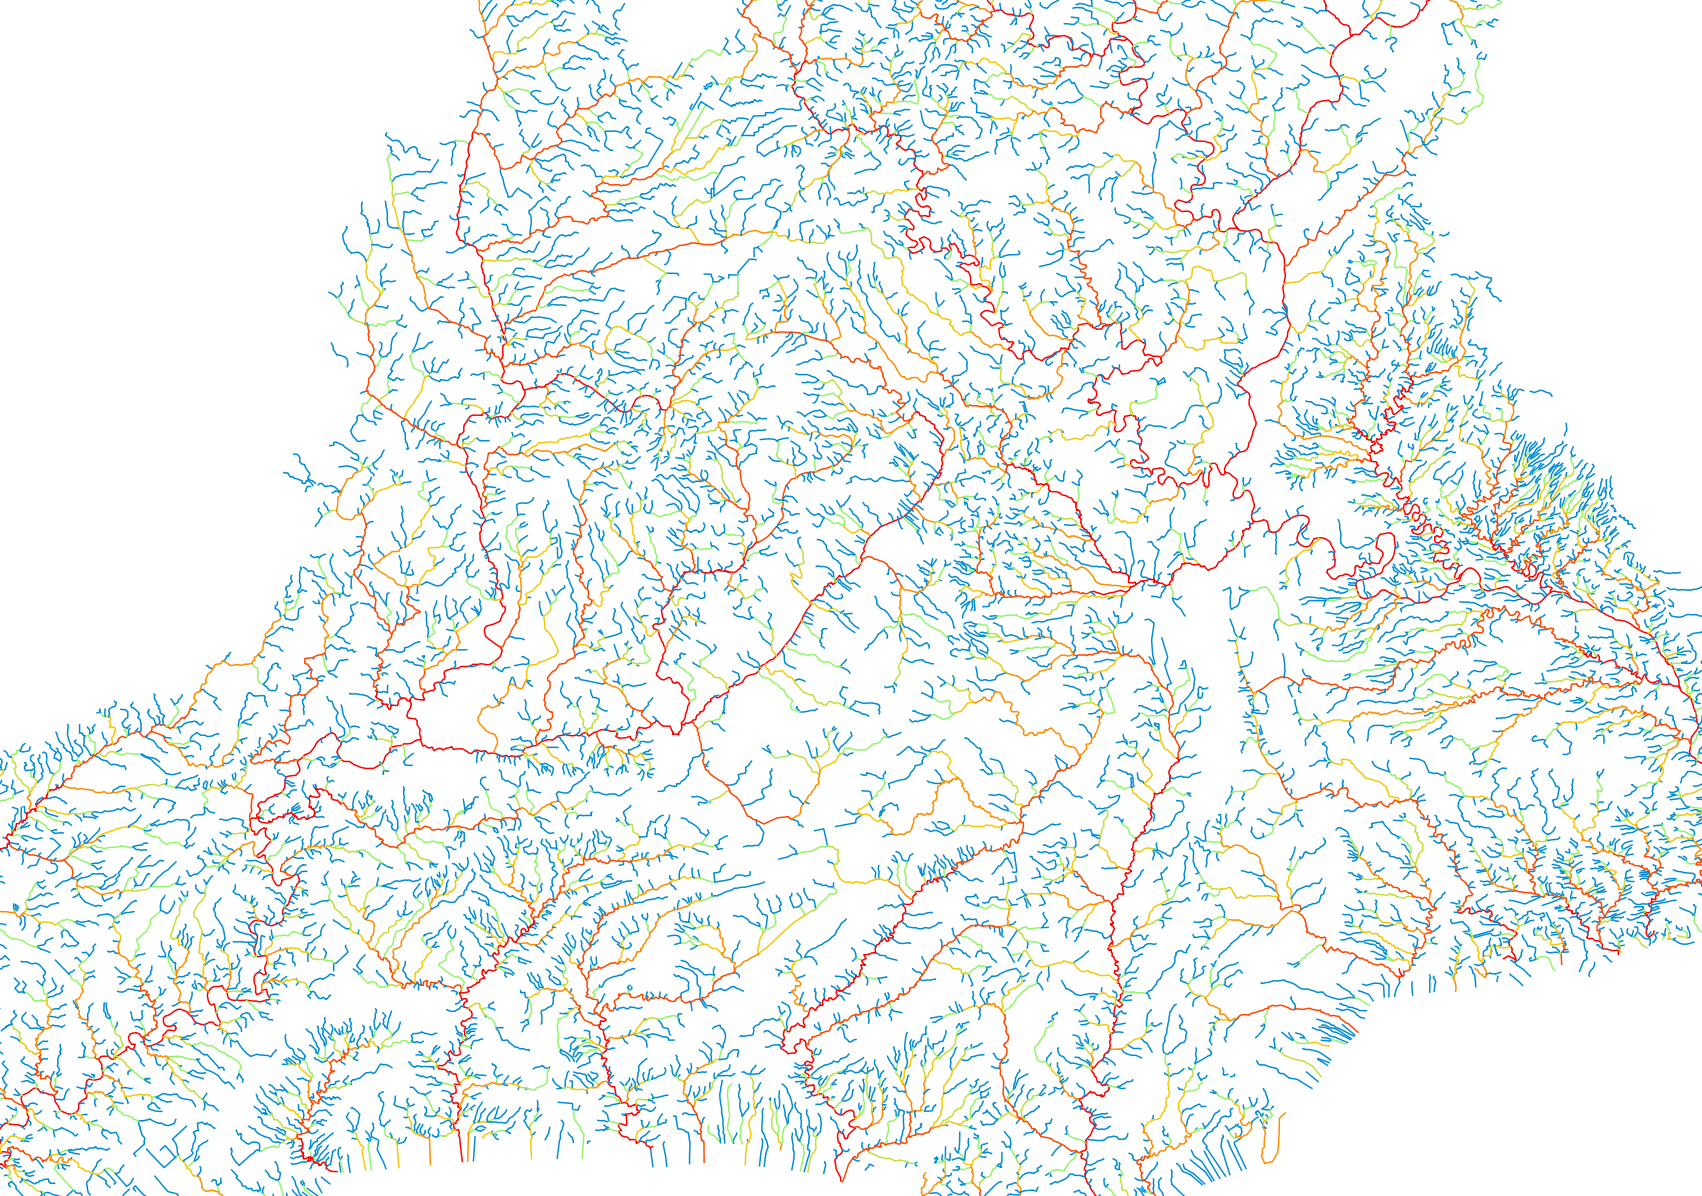
VectorStreamNetworkAnalysis
This tool performs common stream network analysis operations on an input vector stream file (--streams).
The network indices produced by this analysis are contained within the output vector's (--output)
attribute table. The following table shows each of the network indices that are calculated.
| Index Name | Description |
|---|---|
| OUTLET | Unique outlet identifying value, used as basin identifier |
| TRIB_ID | Unique tributary identifying value |
| DIST2MOUTH | Distance to outlet (i.e., mouth node) |
| DS_NODES | Number of downstream nodes |
| TUCL | Total upstream channel length; the channel equivalent to catchment area |
| MAXUPSDIST | Maximum upstream distance |
| HORTON | Horton stream order |
| STRAHLER | Strahler stream order |
| SHREVE | Shreve stream magnitude |
| HACK | Hack stream order |
| MAINSTREAM | Boolean value indicating whether link is the main stream trunk of its basin |
| IS_OUTLET | Boolean value indicating whether link is an outlet link |
In addition to the input and output files, the user must also specify the snap distance
used to associate points at confluences within the network (--snap). It is advisable that the
input streams file be pre-processed prior to analysis using the RepairStreamVectorTopology tool.
Note: The input streams file for this tool should be pre-processed using the RepairStreamVectorTopology and CorrectStreamVectorDirection tools. This is an important step.
OUTLET:
HORTON:
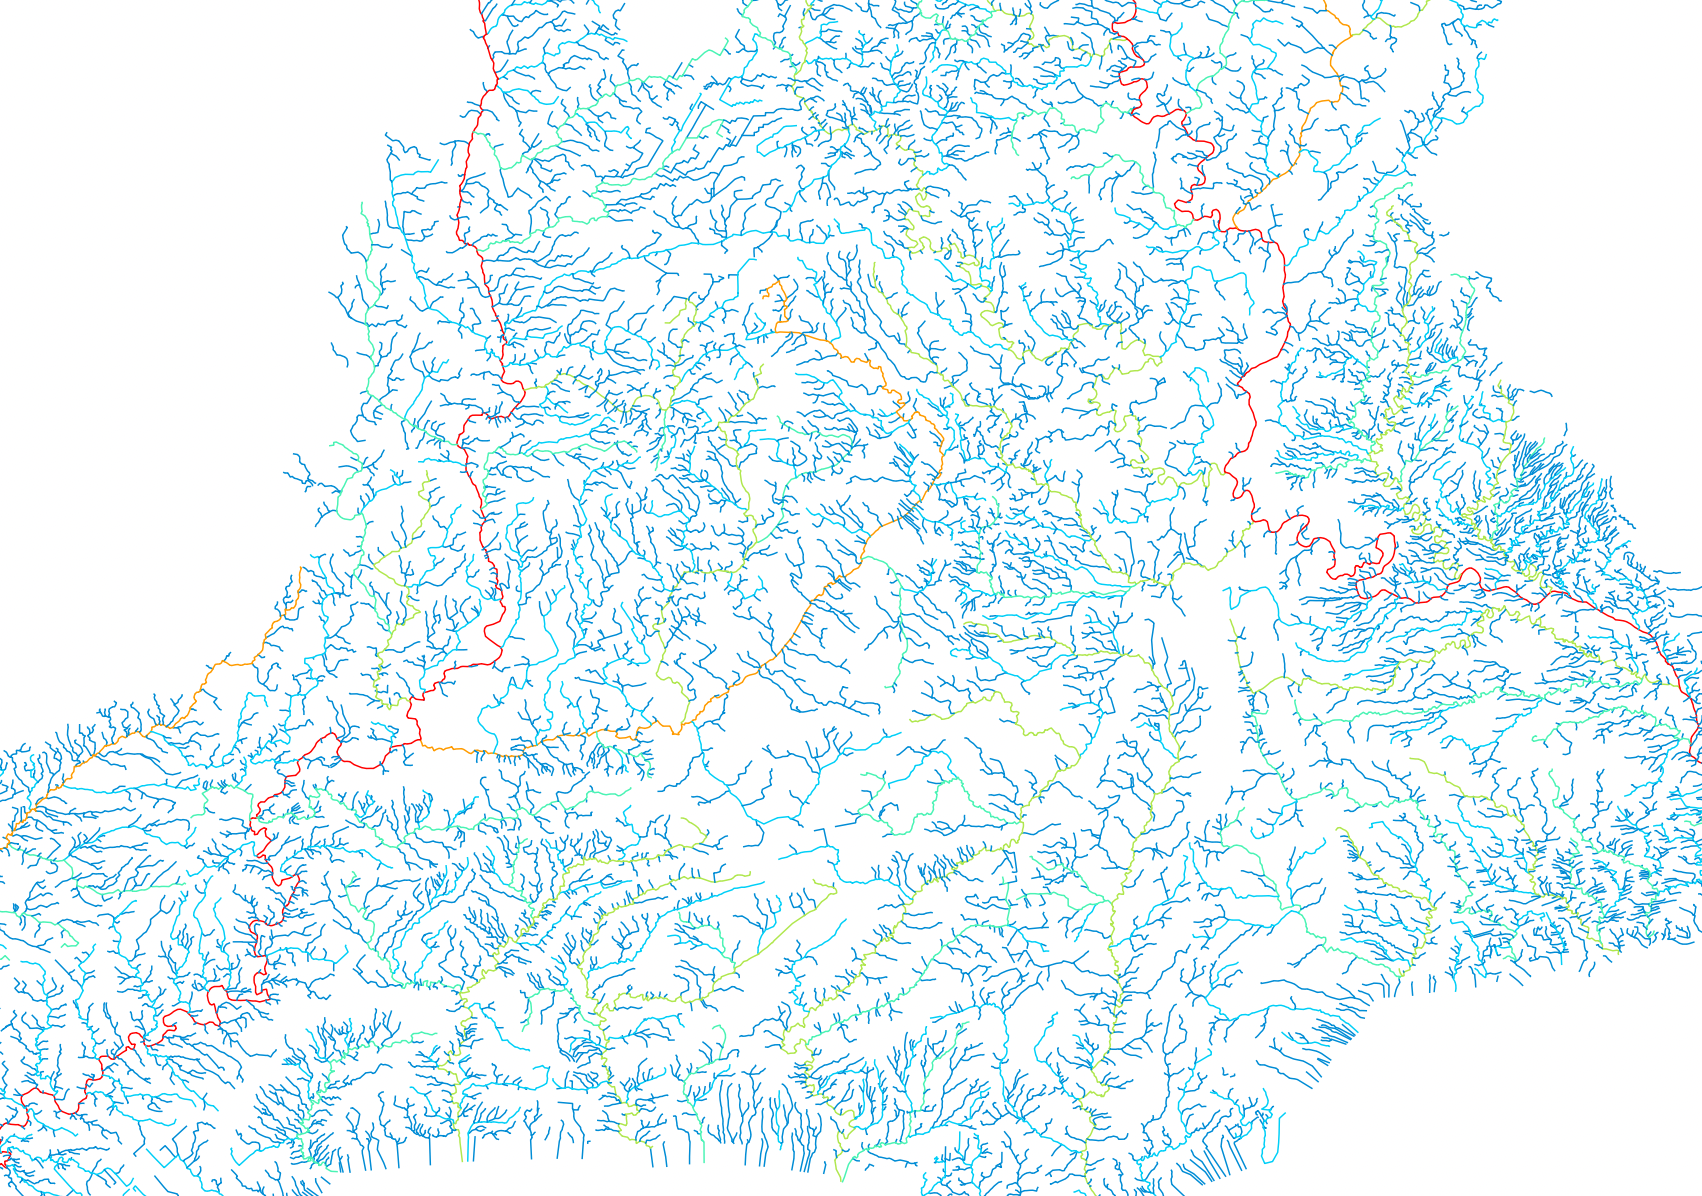
SHREVE:
TRIB_ID:
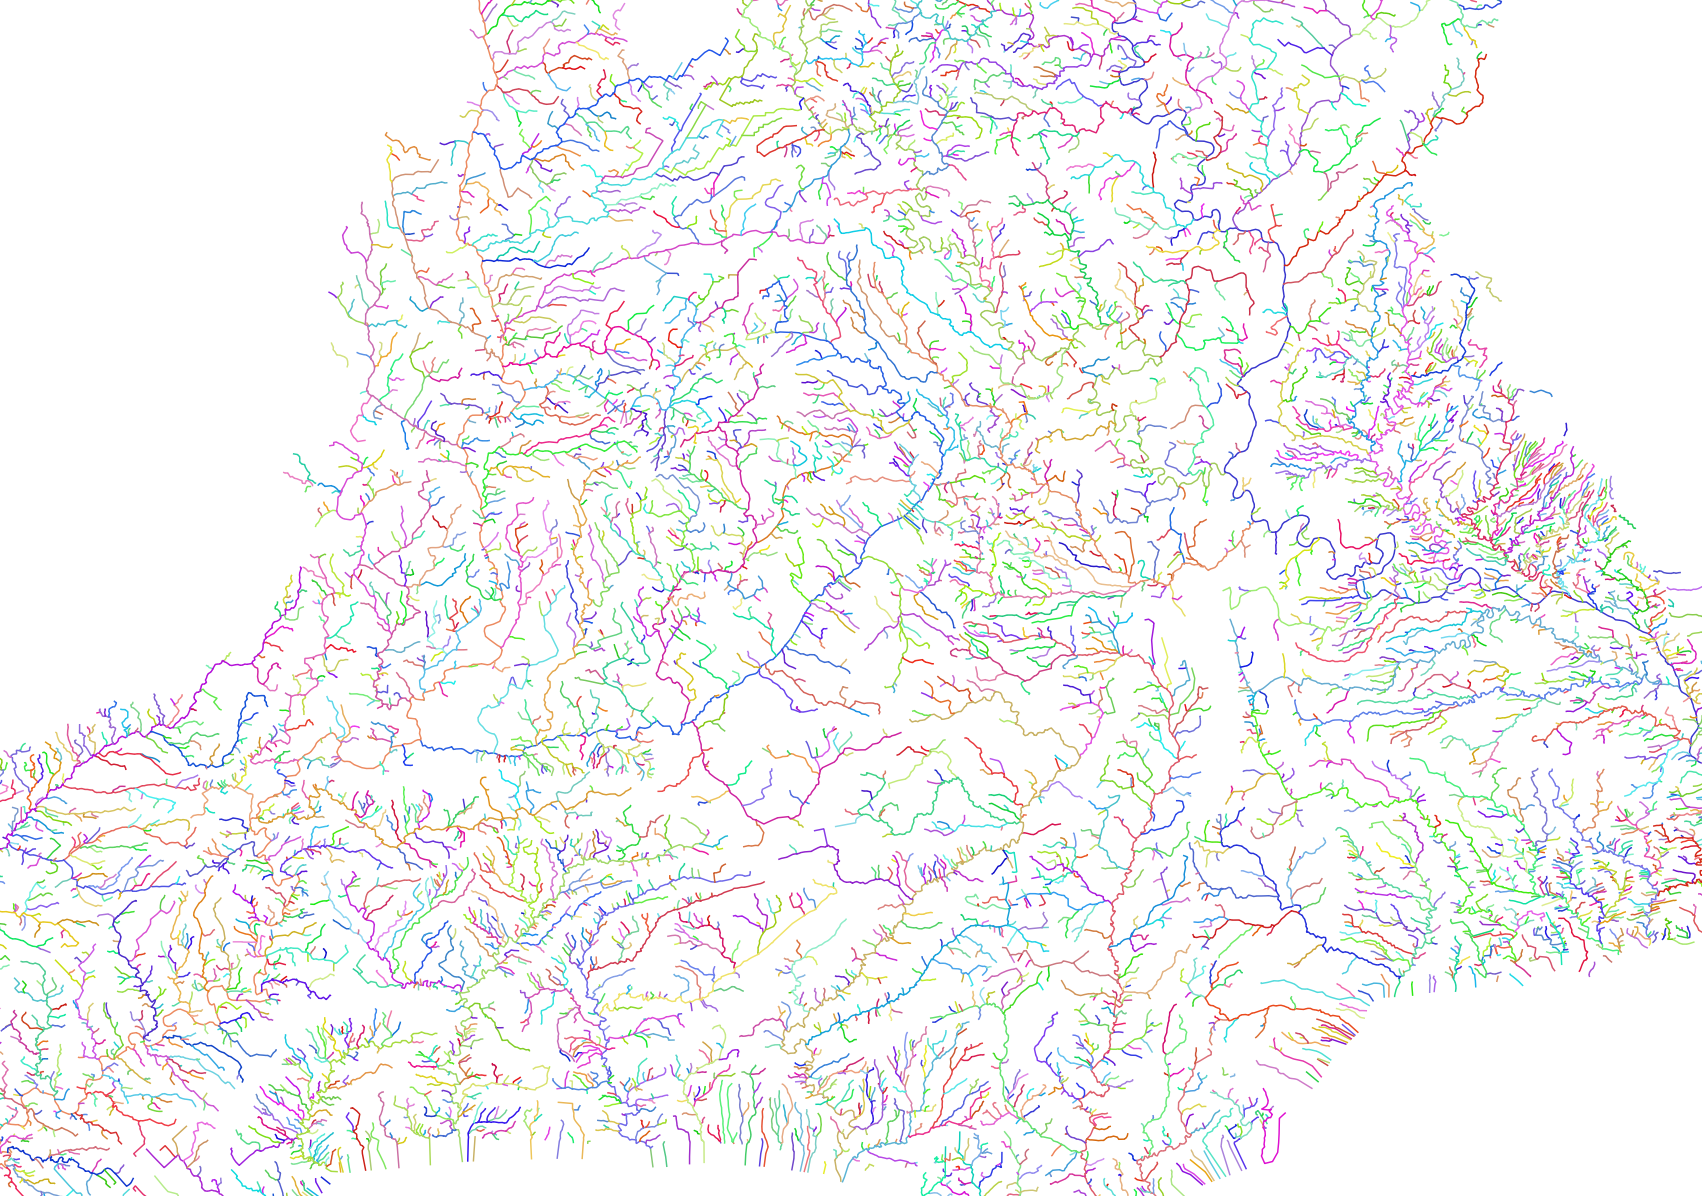
Many of the network indices output by this tool for vector streams have raster equivalents in WhiteboxTools. For example, see the StrahlerStreamOrder, ShreveStreamMagnitude tools.
Reference:
Lindsay, JB, Yang, W, Hornby, DD. 2019. Drainage network analysis and structuring of topologically noisy vector stream data. ISPRS International Journal of Geo-Information. 8(9), 422; DOI: 10.3390/ijgi8090422
See Also: RepairStreamVectorTopology, CorrectStreamVectorDirection, StrahlerStreamOrder, ShreveStreamMagnitude
Parameters:
| Flag | Description |
|---|---|
| --streams | Name of the input streams vector file |
| --dem | Name of the input DEM raster file |
| -o, --output | Name of the output lines shapefile |
| --cutting_height | Maximum ridge-cutting height (z units) |
| --snap | Snap distance, in xy units (metres) |
Python function:
wbt.vector_stream_network_analysis(
    streams,
    dem,
    output,
    cutting_height=10.0,
    snap=0.1,
    callback=default_callback
)
Command-line Interface:
>> ./whitebox_tools -r=VectorStreamNetworkAnalysis ^
--streams=rivers.shp --dem=DEM.tif -o=network_analysis.shp ^
--cutting_height=10.0 --snap=1.0
Source code is unavailable due to proprietary license.
Author: Prof. John Lindsay
Created: 28/07/2021 (oringinally in Whitebox Toolset Extension)
Last Modified: 01/09/2023